a) Temperature and pressure are directly proportional.
b) With increase in temperature, the gas particles gain more Kinetic energy. They move faster and collide with the walls of the container more frequently hence increased pressure.
johnmulu answered the question on April 12, 2017 at 08:32
- The graph below shows the behavior of a fixed mass of a gas at constant temperature.(Solved)
The graph below shows the behavior of a fixed mass of a gas at constant temperature.

a) What is the relationship between the volume and the pressure of the gas?
b) 3 litres of oxygen gas at one atmosphere pressure were compressed to two atmospheres at constant temperature. Calculate the volume occupied by the oxygen gas
Date posted: April 12, 2017. Answers (1)
- The set up below was used to investigate some properties of two gases M and N
(Solved)
The set up below was used to investigate some properties of two gases M and N

When beaker A was filled with gas M, the level of water in the glass tube rose to point II. When the experiment was repeated using gas N, the level of water dropped to point III. Explain the observations.
Date posted: April 12, 2017. Answers (1)
- Study the set-up below and answer the questions that follow.(Solved)
Study the set-up below and answer the questions that follow.

What observation would be made in the tube?
Date posted: April 12, 2017. Answers (1)
- In an experiment to study the diffusion of gases, a student set up the apparatus shown in diagram 1. After sometimes the student noticed a change in the water level as shown in the diagram.(Solved)
In an experiment to study the diffusion of gases, a student set up the apparatus shown in diagram 1. After sometimes the student noticed a change in the water level as shown in the diagram.

Give an explanation for the change in water level
Date posted: April 12, 2017. Answers (1)
- A mixture containing equal volumes of hydrogen and carbon (IV) oxide was introduced at one end of a tube as shown below.(Solved)
A mixture containing equal volumes of hydrogen and carbon (IV) oxide was introduced at one end of a tube as shown below.

Which gas would be detected at point C first? Explain
Date posted: April 12, 2017. Answers (1)
- Study the flow chart below and answer the questions that follow.(Solved)
Study the flow chart below and answer the questions that follow.

a) Give the name of the process that takes place in step 1.
b) Give:
(i) the name of substance G1
(ii) one use of substance F1
Date posted: April 12, 2017. Answers (1)
- The diagram below shows a Jiko when in use. Study it and answer the questions that follow.(Solved)
The diagram below shows a Jiko when in use. Study it and answer the questions that follow.

a) Identify the gas formed at region A
b) State and explain the observation made at region B.
Date posted: April 12, 2017. Answers (1)
- The diagram below represents part of a set-up used to prepare and collect gas T.(Solved)
The diagram below represents part of a set-up used to prepare and collect gas T.

a) Name two reagents that are reacted to produce both carbon (IV) oxide and carbon (II) oxide
b) Write the equation for the reaction which takes place in the wash bottles
c) give a reason why carbon (II) oxide is not easily detected.
Date posted: April 12, 2017. Answers (1)
- The set-up below was used to obtain a sample of iron(Solved)
The set-up below was used to obtain a sample of iron

Write two equations for the reactions which occur in the combustion tube
Date posted: April 12, 2017. Answers (1)
- The set-up below was used to collect gas F, produced by the reaction between water and calcium metal(Solved)
The set-up below was used to collect gas F, produced by the reaction between water and calcium metal

(i) Name gas F.
(ii) At the end of the experiment, the solution in the beaker was found to be a weak base. Explain why the solution is a weak base.
iii) Give one laboratory use of the solution formed in a beaker
Date posted: April 12, 2017. Answers (1)
- Carbon (II) oxide was passed over heated iron (III) oxide as shown in the diagram below.(Solved)
Carbon (II) oxide was passed over heated iron (III) oxide as shown in the diagram below.

a) Give the observation made in tube P.
b) Write the equation for the reaction which takes place in tube P.
Date posted: April 12, 2017. Answers (1)
- When steam was passed over heated charcoal as shown in the diagram below, hydrogen and carbon (II) oxide gases were formed.(Solved)
When steam was passed over heated charcoal as shown in the diagram below, hydrogen and carbon (II) oxide gases were formed.

a) Write the equation for the reaction which takes place.
b) Name two uses of carbon (II) oxide gas, which are also uses of hydrogen gas.
Date posted: April 12, 2017. Answers (1)
- The apparatus shown below was used to investigate the effect of carbon (II) oxide on copper (II) oxide.(Solved)
The apparatus shown below was used to investigate the effect of carbon (II) oxide on copper (II) oxide.

a) State the observation that was made in the combustion tube at the end of the experiment
b) Write an equation for the reaction that took place in the combustion tube.
c) why is it necessary to burn the gas coming out of tube K.
Date posted: April 12, 2017. Answers (1)
- In an experiment, carbon (IV) oxide gas was passed over heated charcoal and the gas produced collected as shown in the diagram below.(Solved)
In an experiment, carbon (IV) oxide gas was passed over heated charcoal and the gas produced collected as shown in the diagram below.
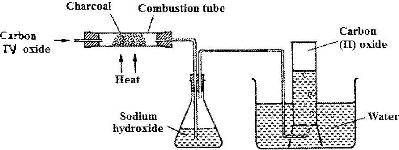
i) Write an equation for the reaction that took place in the combustion tube.
ii) Name another substance that can be used instead of sodium hydroxide
iii) Describe a simple chemical test that can be used to distinguish between carbon (IV) oxide and carbon (II) oxide.
iv) Give one use of carbon (II) oxide.
Date posted: April 10, 2017. Answers (1)
- The following diagrams show the structures of two allotropes of carbon. Study them and answer the questions that follow.(Solved)
The following diagrams show the structures of two allotropes of carbon. Study them and answer the questions that follow.

Allotrope M
(i) Name allotrope M and N
(ii) Give one use of N
(iii) Which allotrope conduct electricity? Explain.
Date posted: April 10, 2017. Answers (1)
- Study the information in the table below and answer the questions that follow.
(The letters do not represent the actual symbols of the elements.)
(Solved)
Study the information in the table below and answer the questions that follow.
(The letters do not represent the actual symbols of the elements.)

Select an element which:
a) Is likely to be in group II of the periodic table.
b) Could be used to make electric cables
c) Is likely to be graphite
Date posted: April 10, 2017. Answers (1)
- The simplified flow chart shows some of the steps in the manufacture of sodium carbonate by the Solvay process.(Solved)
The simplified flow chart shows some of the steps in the manufacture of sodium carbonate by the Solvay process.
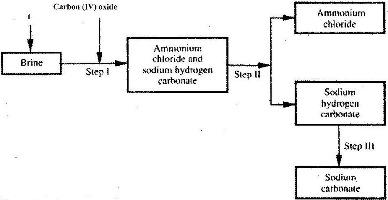
a) Identify substance L.
b) Name the process taking place in step II.
c) Write an equation for the reaction, which takes place in step III.
Date posted: April 10, 2017. Answers (1)
- The diagram below represents a charcoal burner. Study it and answer the question that follows:(Solved)
The diagram below represents a charcoal burner. Study it and answer the question that follows:

Date posted: April 10, 2017. Answers (1)
- A student investigated the effect of an electric current by passing it through some substances. The student used inert electrodes, and connected a bulb to the circuit. The table below shows the substances used and their states.(Solved)
A student investigated the effect of an electric current by passing it through some substances. The student used inert electrodes, and connected a bulb to the circuit. The table below shows the substances used and their states.

a) In which experiment did the bulb not light?
b) Explain your answer in (a) above.
Date posted: April 10, 2017. Answers (1)
- An electric current was passed through several substances and the results obtained recorded in the table below.(Solved)
An electric current was passed through several substances and the results obtained recorded in the table below.
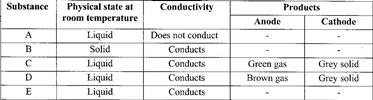
Which of these substances is likely to be:
a) Magnesium
b) Hexane
c) Lead (II) bromide
Date posted: April 10, 2017. Answers (1)