i) 5 cm
ii) periodic time, T = 25 - 5 = 20
Frequency = 1T = 120 = 0.05Hz
johnmulu answered the question on April 19, 2017 at 13:25
- Figure 2 shows how the displacement varies with time for a certain wave(Solved)
Figure 2 shows how the displacement varies with time for a certain wave

Determine the frequency of the wave.
Date posted: April 19, 2017. Answers (1)
- Figure 4 shows the displacement - time graph for a certain wave(Solved)
Figure 4 shows the displacement - time graph for a certain wave

Determine the frequency of the wave
Date posted: April 19, 2017. Answers (1)
- A long coil is attached to a vibrating blade as shown in Figure(Solved)
A long coil is attached to a vibrating blade as shown in Figure
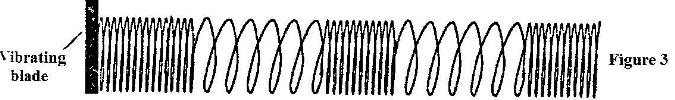 State the type of mechanical wave generated by the set-up and mark alongside the coil, the length corresponding to the wavelength, wavelength of the wave.
Date posted: April 19, 2017. Answers (1)
- Figure 10 represents a transverse wave of frequency 5 Hz traveling in the X direction. Determine the speed of the wave.(Solved)
Figure 10 represents a transverse wave of frequency 5 Hz traveling in the X direction. Determine the speed of the wave.

Date posted: April 19, 2017. Answers (1)
- Figure 5 shows the displacement time graph of a wave travelling at 200 cm/s.(Solved)
Figure 5 shows the displacement time graph of a wave travelling at 200 cm/s.

Determine for the wave, the
i) Amplitude
ii) Period
iii) frequency
iv) Wavelength
Date posted: April 19, 2017. Answers (1)
- Figure 3 shows a transverse wave traveling along x-axis(Solved)
Figure 3 shows a transverse wave traveling along x-axis

i) Determine the:
I. Wavelength of the wave
II. Amplitude of the wave
ii) If the time taken by the wave to move from O to A is 0.90 seconds, determine the:
I. frequency of the wave
II. Speed of the wave
Date posted: April 19, 2017. Answers (1)
- The three springs shown in figure 7 are identical and have negligible weight. The extension produced on the system of springs is 20 cm.(Solved)
The three springs shown in figure 7 are identical and have negligible weight. The extension produced on the system of springs is 20 cm.

Determine the constant of each spring.
Date posted: April 19, 2017. Answers (1)
- Table 1 shows the results of an experiment carried out to study the properties of a spring
(Solved)
Table 1 shows the results of an experiment carried out to study the properties of a spring

State with a reason whether the experiment was done within the elastic limit of the spring.
Date posted: April 19, 2017. Answers (1)
- Figure 2 shows a spring balance. Its spring constant is 125Nm-1. The scale spreads over a distance of 20 cm.
(Solved)
Figure 2 shows a spring balance. Its spring constant is 125Nm-1. The scale spreads over a distance of 20 cm.

Determine the maximum weight that can be measured using the spring.
Date posted: April 19, 2017. Answers (1)
- The three springs shown in Figure 5 are identical and have negligible weight. The extension produced on the system of springs is 20 cm.(Solved)
The three springs shown in Figure 5 are identical and have negligible weight. The extension produced on the system of springs is 20 cm.

Determine the constant of each spring
Date posted: April 19, 2017. Answers (1)
- The graph in Fig. 7 represent the relations between extension, e and mass, m added on two springs x and y.(Solved)
The graph in Fig. 7 represent the relations between extension, e and mass, m added on two springs x and y.
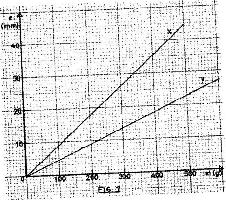
Given that the two springs are made of same materials, give a reason why the graphs are different
Date posted: April 19, 2017. Answers (1)
- The spiral spring shown in Figure 4 are identical. Each spring has a spring constant k = 300 N/m(Solved)
The spiral spring shown in Figure 4 are identical. Each spring has a spring constant k = 300 N/m
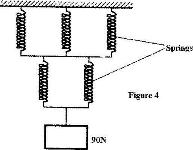
Determine the total extension caused by the 90 N weight. (Ignore the weight of the springs and connecting rods)
Date posted: April 19, 2017. Answers (1)
- Two identical spring balances R and S each weighing 0.5 N are arranged as shown in Figure 2.(Solved)
Two identical spring balances R and S each weighing 0.5 N are arranged as shown in Figure 2.
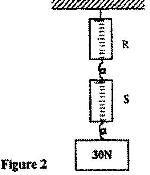
What is the reading on balance R?
Date posted: April 19, 2017. Answers (1)
- Figure 7 shows a simple electric bell circuit
(Solved)
Figure 7 shows a simple electric bell circuit
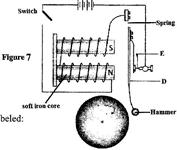
i) Name the parts labeled:
I) D
II) E
ii) When the switch is closed, the hammer hits the gong repeatedly. Explain why?
I) The hammer hits the gong.
II) The hammer hits the gong repeatedly
Date posted: April 19, 2017. Answers (1)
- Figure 7 shows two similar coils P and Q around the end L and M of a piece of soft iron. A steady current passes through the coils (Solved)
Figure 7 shows two similar coils P and Q around the end L and M of a piece of soft iron. A steady current passes through the coils
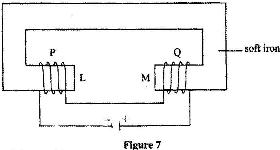
State the polarity of the resulting magnet at point L
Date posted: April 19, 2017. Answers (1)
- Figure 5, shows a motor connected to a magnetic switch called a relay operated by an ordinary switch S1. Use the information in the figure to answer questions a) and b)(Solved)
Figure 5, shows a motor connected to a magnetic switch called a relay operated by an ordinary switch S1. Use the information in the figure to answer questions a) and b)
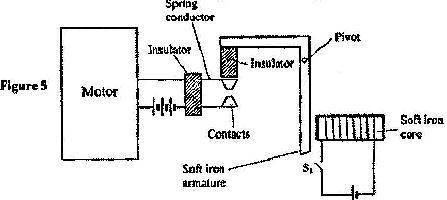
a) Explain how the relay switches on the motor when S1 is closed
b) State with a reason the effect on the motor, if the iron core is replaced with a steel core and switch S1 is put on and then off.
Date posted: April 19, 2017. Answers (1)
- Figure 3 shows a flat spring made of iron clamped horizontally on the bench over a solenoid.(Solved)
Figure 3 shows a flat spring made of iron clamped horizontally on the bench over a solenoid.
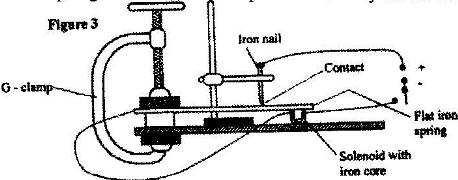
When the switch is closed, the spring vibrates. Explain this observation.
Date posted: April 19, 2017. Answers (1)
- Figure 8 shows a current-carrying coil in a magnetic field (Solved)
Figure 8 shows a current-carrying coil in a magnetic field
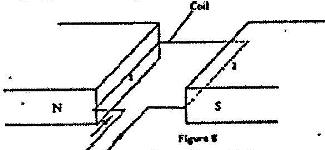
State two ways of increasing the force on the coil
Date posted: April 19, 2017. Answers (1)
- Figure 8 shows two parallel thick copper conductors connected to a d.c. power supply. A rider made from a thin copper wire is placed on the conductors(Solved)
Figure 8 shows two parallel thick copper conductors connected to a d.c. power supply. A rider made from a thin copper wire is placed on the conductors
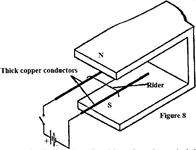
State and explain what is observed on the rider when the switch is closed.
Date posted: April 19, 2017. Answers (1)
- Figure 2 shows the circuit of a simple telephone receiver(Solved)
Figure 2 shows the circuit of a simple telephone receiver. When the telephone is lifted a steady current flows through the solenoids. When a person speaks into the microphone on the other side, a varying current flows. These two currents are shown in Figure 2 (b)
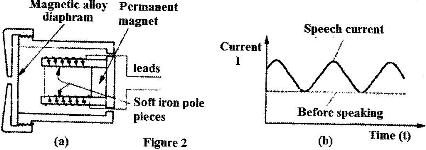
i) State the reason why the solenoids are wound in opposite directions around the soft-iron core pieces as shown.
ii) Explain how the speech current from the microphone is converted into sound in the direction receiver.
iii) State and explain the effect of replacing the soft iron core pieces with steel core pieces
Date posted: April 19, 2017. Answers (1)