i) Put soil in water in a beaker. To the mixture add a universal indicator and compare the colour change to the pH chart
OR
Add distilled water to the soil sample and stir. Add 2 drops of universal indicator to the
mixture and compare with the PH chart
ii) Addition of nitrogenous fertilizers which are acidic
OR
- Extensive use of acidic fertilizers
- Pollution by acid rain.
johnmulu answered the question on April 21, 2017 at 12:44
-
The set-up below was used to demonstrate the effect of heat on hard water
(Solved)
The set-up below was used to demonstrate the effect of heat on hard water
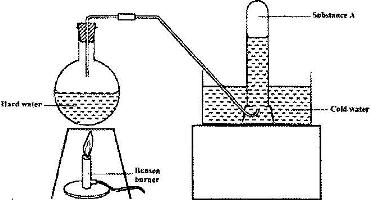
a) Name substance A.
b) Explain why the heating of hard water produced substance A.
Date posted:
April 21, 2017
.
Answers (1)
-
In an experiment, student put equal volumes of mixtures of ethanoic acid in water and ethanoic acid in hexane in two test-tubes as shown below. In each test-tube, equal amounts of solid hydrogen carbonate were added.
(Solved)
In an experiment, student put equal volumes of mixtures of ethanoic acid in water and ethanoic acid in hexane in two test-tubes as shown below. In each test-tube, equal amounts of solid hydrogen carbonate were added.
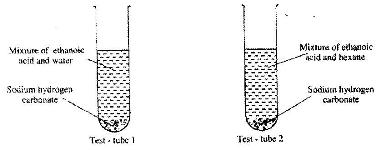
a) State the observation which was made in each test-tube.
b) Explain the observation in (a) above.
Date posted:
April 21, 2017
.
Answers (1)
-
The table below shows the tests carried out on a sample of water and the results obtained.
(Solved)
The table below shows the tests carried out on a sample of water and the results obtained.
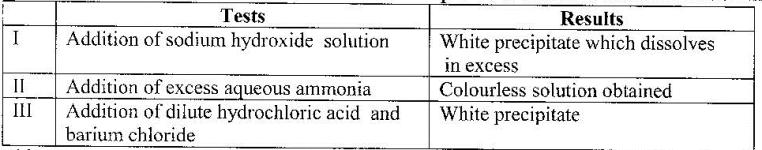
a) Identify the anion present in the water.
b) Write the formula of the complex ion formed in II
Date posted:
April 21, 2017
.
Answers (1)
-
In an experiment equal amounts of magnesium powder were placed into test-tube 1 and 2 as shown below
(Solved)
In an experiment equal amounts of magnesium powder were placed into test-tube 1 and 2 as shown below
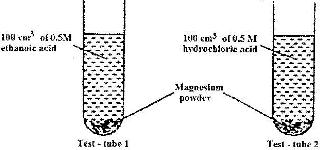
Explain why the amount of hydrogen gas liberated in test - tube 2 is greater than in test-tube 1 before the reaction is complete
Date posted:
April 21, 2017
.
Answers (1)
-
Study the information in the table below and answer the questions that follow. (The letters do not represent the actual symbols of the element)
(Solved)
Study the information in the table below and answer the questions that follow. (The letters do not represent the actual symbols of the element)

i) What is the general name to the group in which elements P, Q and R belong?
ii) What is meant by ionization energy?
iii) Explain why element P have the highest ionization energy.
Date posted:
April 21, 2017
.
Answers (1)
-
The flow chart below shows the various stages of water treatment. Study it and answer the questions that follow.
(Solved)
The flow chart below shows the various stages of water treatment. Study it and answer the questions that follow.

i) Which substance are likely to be removed in filtration unit I?
ii) What is the name of the process Y?
iii) What is the purpose of:
I. Process Y
II. Addition of sodium hypochlorite
Date posted:
April 21, 2017
.
Answers (1)
-
The table below shows the tests carried out on separate samples of water drawn from a well and the results obtained.
(Solved)
The table below shows the tests carried out on separate samples of water drawn from a well and the results obtained.

a) Identify the cation and the anion present in the water.
b) Write an ionic equation for the reaction which takes place in test (iii).
Date posted:
April 21, 2017
.
Answers (1)
-
Study the solubility curves below and answer the question that follows.
(Solved)
Study the solubility curves below and answer the question that follows.
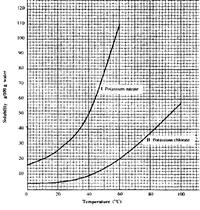
What happens when a solution containing 40 g of potassium chlorate and 40 g of potassium nitrate in 100 g of water at 90oC is cooled 40oC? Explain.
Date posted:
April 21, 2017
.
Answers (1)
-
The table below shows the pH values of solutions I, II, and IV.
(Solved)
The table below shows the pH values of solutions I, II, and IV.

a) Which solution is likely to be that of calcium hydroxide?
b) Select the solution in which a sample of aluminium oxide is likely to dissolve. Give a reason for your answer
Date posted:
April 21, 2017
.
Answers (1)
-
The table below shows the solubility of a salt at various temperatures
(Solved)
The table below shows the solubility of a salt at various temperatures
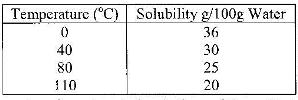
What would happen if a sample of a saturated solution of the salt at 40o C is heated to 80oC.Explain
Date posted:
April 21, 2017
.
Answers (1)
-
Study the flow chart below and answer the questions that follow
(Solved)
Study the flow chart below and answer the questions that follow

Name:
i) The reagent used in step I
ii) Compound A
Date posted:
April 21, 2017
.
Answers (1)
-
The column below was used to soften hard water
(Solved)
The column below was used do soften hard water

i) Explain how the hard water was softened as it passed through the column.
ii) After sometimes the material in the column is not able to soften hard water. How can the material be reactivated?
Date posted:
April 21, 2017
.
Answers (1)
-
The scheme below shows some reaction sequence starting with solid N.
(Solved)
The scheme below shows some reaction sequence starting with solid N.

a) Identify solid N.
b) Write the formula of the complex ion present in solution Q
Date posted:
April 21, 2017
.
Answers (1)
-
Study the information in the table and answer the question below the table.
(Solved)
Study the information in the table and answer the question below the table.
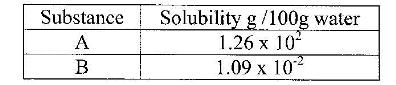
Describe how a solid sample of substance A could be obtained from a solid mixture of A and B
Date posted:
April 21, 2017
.
Answers (1)
-
Study the scheme below and answer the questions that follow
(Solved)
Study the scheme below and answer the questions that follow
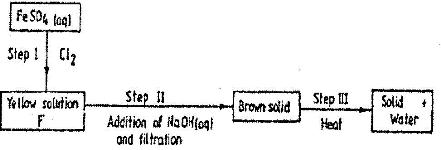
a) Write the formula of the caution present in solution F.
b) What property of chlorine is shown in step I
Date posted:
April 21, 2017
.
Answers (1)
-
The flow charts below show an analysis of a mixture R that contains two salts. Study the analysis and answer the questions that follow.
(Solved)
The flow charts below show an analysis of a mixture R that contains two salts. Study the analysis and answer the questions that follow.
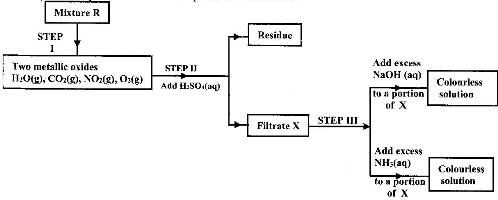
i) What condition is necessary for the process in step I to take place.
ii) Write an ionic equation for the reaction between the cation in filtrate X and aqueous ammonia
iii) What observation would indicate the presence of NO2(g) in step I?
iv) State how water vapour, in step I could be identified.
Date posted:
April 21, 2017
.
Answers (1)
-
The table shows how solubility of some substances in water varies with temperature
(Solved)
The table shows how solubility of some substances in water varies with temperature
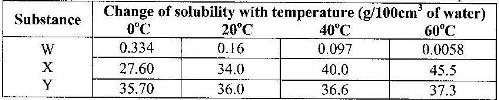
Which of the above substances is likely to be a gas? EXplain
Date posted:
April 21, 2017
.
Answers (1)
-
In an experiment, soap solution was added to three separate samples of water. The table below shows the volumes of soap solutions required to form lather with 1000cm3 of each sample of water before and after boiling.
(Solved)
In an experiment, soap solution was added to three separate samples of water. The table below shows the volumes of soap solutions required to form lather with 1000cm3 of each sample of water before and after boiling.
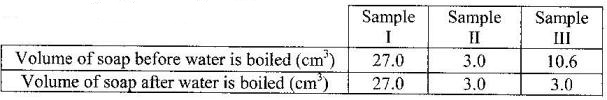
a) Which water sample is likely to be soft? Explain
b) Name the cause of change in the volume of soap solution used in sample III
Date posted:
April 21, 2017
.
Answers (1)
-
The diagram below represents the set-up that was used to prepare and collect hydrogen chloride gas in the laboratory.
(Solved)
The diagram below represents the set-up that was used to prepare and collect hydrogen chloride gas in the laboratory.
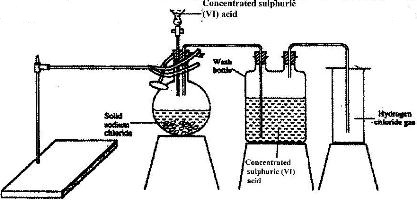
a) State the purpose of concentrated sulphuric (VI) acid in the wash bottle.
b) Write an equation for the reaction between dry hydrogen chloride gas and heated iron
Date posted:
April 21, 2017
.
Answers (1)
-
The diagram below is representation of an industrial process for the manufacture of a bleaching powder.
(Solved)
The diagram below is representation of an industrial process for the manufacture of a bleaching powder.
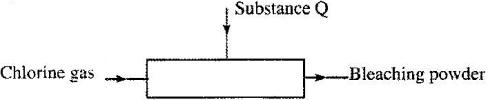
i) Name substance Q.
ii) When the bleaching powder is added to water during washing, a lot of soap is used. Explain.
Date posted:
April 21, 2017
.
Answers (1)