(a) Substance changes from solid to liquid state.
(b) Substance changes from liquid to gaseous state.
johnmulu answered the question on May 27, 2017 at 09:16
- Figure 8 shows a set-up of apparatus set in an experiment to determine the specific latent of fusion of ice. (Solved)
Figure 8 shows a set-up of apparatus set in an experiment to determine the specific latent of fusion of ice.

The following reading was noted after the heater was switched on for 5 minutes:
- mass of beaker = 130g
- mass of beaker + melted ice = 190 g
(i) Determine the:
(I) Energy supplied by the 60 W heater in the 5 minutes.
(II) Specific latent heat of fusion of ice.
(ii) It was observed that some of the crushed ice melted even before the heater was switched on. State a reason for this observation.
Date posted: May 27, 2017. Answers (1)
- Figure 4 shows a graph of temperature against time when pure melting ice at 0oC is heated uniformly. (Solved)
Figure 4 shows a graph of temperature against time when pure melting ice at 0oC is heated uniformly.

Explain what happens between parts:
(i) OA
(ii) AB
Date posted: May 27, 2017. Answers (1)
- You are provided with the apparatus shown in fig. 9 and a stop watch. (Solved)
You are provided with the apparatus shown in fig. 9 and a stop watch.

Describe an experiment to determine the specific latent heat of steam, l, using the set up. In your answer clearly explain the measurements to be made and how these measurements could be used to determine l.
Date posted: May 27, 2017. Answers (1)
- Figure 11 shows the features of a domestic refrigerator. A volatile liquid circulates through the capillary tubes under the action of the compression pump. (Solved)
Figure 11 shows the features of a domestic refrigerator. A volatile liquid circulates through the capillary tubes under the action of the compression pump.

(i) State the reaction for using a volatile liquid.
(ii) what is the purpose of double wall?
Date posted: May 27, 2017. Answers (1)
- Fig. 11 shows the variation of temperature,θ, with time t,when an immersion heater is used to heat certain liquid. Study the figure and answer questions 22 and 23. (Solved)
Fig. 11 shows the variation of temperature,θ, with time t,when an immersion heater is used to heat certain liquid. Study the figure and answer question.

State the reason for the shape of graph in the section labeled BC
Date posted: May 27, 2017. Answers (1)
- Figure 5 shows the variation of temperature, T (oC), with time, t (seconds) when frozen sea water is heated for some time.
(Solved)
Figure 5 shows the variation of temperature, T (oC), with time, t (seconds) when frozen sea water is heated for some time.

(i) Explain the shape of the curve at the parts labeled A, B and C.
(ii) It is observed that when the temperature starts to rise, the volume initially decreases and then increases. State the reason for this observation.
Date posted: May 27, 2017. Answers (1)
- Figure 3 shows two aluminium containers, A and B placed on a wooden table. A and B have equal volumes of hot water initially at the same temperature. (Solved)
Figure 3 shows two aluminium containers, A and B placed on a wooden table. A and B have equal volumes of hot water initially at the same temperature.

Explain why the water in B cools faster than the water in A.
Date posted: May 27, 2017. Answers (1)
- Figure 9, shows a circuit that may be used to charge a capacitor. (Solved)
Figure 9, shows a circuit that may be used to charge a capacitor.

(i) State the observation on the milliameter when the circuit is switched on.
(ii) Explain the observation in (i) above.
Date posted: May 27, 2017. Answers (1)
- Figure 5 shows the circuit used to charge a capacitor C. (Solved)
Figure 5 shows the circuit used to charge a capacitor C.

State what would be observed on the following when the switch is closed:
(I) The milliammeter;
(II) The voltmeter;
Date posted: May 27, 2017. Answers (1)
- Figure 7 shows capacitors A and B connected in series with a battery of e.m.f 4 V
(Solved)
Figure 7 shows capacitors A and B connected in series with a battery of e.m.f 4 V

Determine:
(i) The effective capacitance of the circuit.
(ii) The quantity of charge in capacitor A.
Date posted: May 27, 2017. Answers (1)
- Figure 3 shows a voltmeter connected across two charged parallel plates. (Solved)
Figure 3 shows a voltmeter connected across two charged parallel plates.

When a thin sheet of mica is inserted between the plates, the voltmeter reading is observed to reduce. Explain this observation.
Date posted: May 27, 2017. Answers (1)
- Figure 8, shows a circuit that may be used to charge a capacitor. (Solved)
Figure 8, shows a circuit that may be used to charge a capacitor.

(i) State the observation on the milliammmeter when the circuit is switched on.
(ii) Explain the observation in (i) above.
Date posted: May 27, 2017. Answers (1)
- Figure 7 shows a pair of parallel plates of a capacitor connected to a battery. The upper plates is displaced slightly to the left. (Solved)
Figure 7 shows a pair of parallel plates of a capacitor connected to a battery. The upper plates is displaced slightly to the left.

State with reason the effect of this movement on the capacitance.
Date posted: May 27, 2017. Answers (1)
- The capacitors in the circuit in Figure 14 are identical and initially uncharged. (Solved)
The capacitors in the circuit in Figure 14 are identical and initially uncharged.

Switch S1 is closed while switch S2 remains open. After sometimes, switch S1 is opened and switch S2 closed. Determine the final reading of the voltmeter, V.
Date posted: May 26, 2017. Answers (1)
- Figure 20 shows three capacitors connected between two points A and B. (Solved)
Figure 20 shows three capacitors connected between two points A and B.

Determine the capacitance across AB.
Date posted: May 26, 2017. Answers (1)
- Figure 11 shows part of the circuit containing two capacitors of 2uF and 3uF respectively
(Solved)
Figure 11 shows part of the circuit containing two capacitors of 2uF and 3uF respectively

Determine the p.d across AB given that the total charge in the capacitors is 1 x 10⁻⁴ coulombs.
Date posted: May 26, 2017. Answers (1)
- Figure 7 shows a "windmill" which when connected to the dome of a positively charged Van de Graff generator is observed to rotate as indicated. A, B, C and D are sharp points. (Solved)
Figure 7 shows a "windmill" which when connected to the dome of a positively charged Van de Graff generator is observed to rotate as indicated. A, B, C and D are sharp points.

Explain how this rotation is caused.
Date posted: May 26, 2017. Answers (1)
- Figure 15 shows a battery of e.m.f. 3.0 V connected in series with two capacitors. (Solved)
Figure 15 shows a battery of e.m.f. 3.0 V connected in series with two capacitors.

Determine the charge stored in the combined capacitors when the switch S is closed.
Date posted: May 26, 2017. Answers (1)
- Figure 7 shows a sharp pin fixed on a cap of leaf electroscope. The electroscope is highly charged and then left for some time. (Solved)
Figure 7 shows a sharp pin fixed on a cap of leaf electroscope. The electroscope is highly charged and then left for some time.
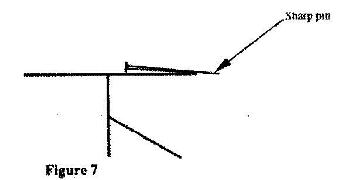
Explain why the leaf collapses.
Date posted: May 26, 2017. Answers (1)
- Fig 5 shows a circuit for changing and discharging a capacitor, c, through a variable resistor R. X, Y and T are points on a two-way switch. (Solved)
Fig 5 shows a circuit for changing and discharging a capacitor, c, through a variable resistor R. X, Y and T are points on a two-way switch.

Explain how the charging and discharging processes are achieved.
Date posted: May 26, 2017. Answers (1)