- Figure shows the three nuclear radiations labelled A, B and C under the influence of magnetic into the paper.(Solved)
Figure shows the three nuclear radiations labelled A, B and C under the influence of magnetic into the paper.

i) State one property of the radiation labelled A
ii) State one use of the radiation B
Date posted: March 26, 2019. Answers (1)
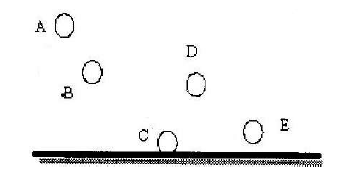
- The figure shows positions of a ball bouncing on a floor. State the energy changes at C.(Solved)
The figure shows positions of a ball bouncing on a floor. State the energy changes at C.
Date posted: March 26, 2019. Answers (1)
- The following equation shows part of a radioactive decay process.(Solved)
The following equation shows part of a radioactive decay process.
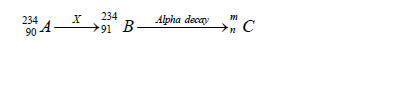
i) Name the radiation X.
ii) Find the values of m and n.
Date posted: March 26, 2019. Answers (1)
- Figure below shows an electric circuit.(Solved)
Figure below shows an electric circuit.
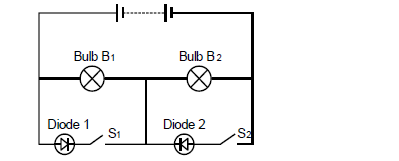
Explain what happens when only S2 is closed.
Date posted: March 26, 2019. Answers (1)
- In terms of energy band theory state the difference conductors and semiconductors.(Solved)
In terms of energy band theory state the difference conductors and semiconductors.
Date posted: March 26, 2019. Answers (1)
- Figure below shows a block of mass 30.0 kg being pulled up a slope by force P at a constant speed. The frictional force on...(Solved)
Figure below shows a block of mass 30.0 kg being pulled up a slope by force P at a constant speed. The frictional force on the block is 20.0N
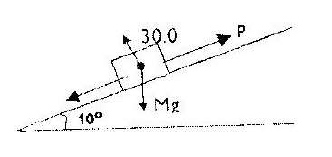
i) On the same figure name and indicate other forces acting on the block.
ii) Determine the component of the weight acting on the trolley down the slope
iii) Determine the value of P.
Date posted: March 26, 2019. Answers (1)
- Figure below shows a set up used to observe photoelectric effect.(Solved)
Figure below shows a set up used to observe photoelectric effect.
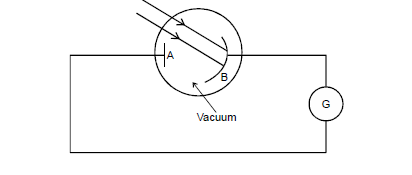
i) State two factors that determine whether photoelectric effect will occur or not when the radiation strikes the metal surface B.
ii) State one way in which the reading on the galvanometer can be increased.
Date posted: March 26, 2019. Answers (1)
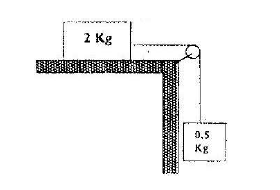
- The fig. shows a 2 kg block attached to 0.5 kg mass by a light in-extensible string which passes over a pulley. The force of...(Solved)
The fig. shows a 2 kg block attached to 0.5 kg mass by a light in-extensible string which passes over a pulley. The force of friction between the horizontal bench and block is 3N. The block is released from rest so that both masses move through a distance of 0.6m. Calculate the velocity of the string.
Date posted: March 26, 2019. Answers (1)
- Figure below shows a simplified illustration of an x-ray tube.(Solved)
Figure below shows a simplified illustration of an x-ray tube.
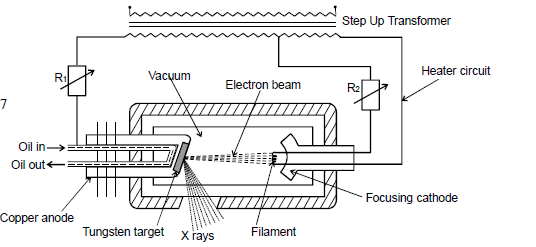
state the functions of R1 and R2
Date posted: March 26, 2019. Answers (1)
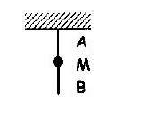
- The diagram shows two identical strings A and B attached to a large mass M. String A is attached to the ceiling. State the reason...(Solved)
The diagram shows two identical strings A and B attached to a large mass M. String A is attached to the ceiling. State the reason why string B cuts when its free and is suddenly pulled downward.
Date posted: March 26, 2019. Answers (1)
- In figure shown below. Two identical electroscopes A and B carry the same type of charges as shown. The two are then connected with a...(Solved)
In figure shown below. Two identical electroscopes A and B carry the same type of charges as shown. The two are then connected with a copper wire.
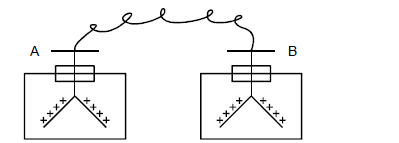
State and explain the observations made.
Date posted: March 26, 2019. Answers (1)
- The diagram shows a block of mass 5 kg sliding down from rest on a plane incline at an angle of 300 to the horizontal....(Solved)
The diagram shows a block of mass 5 kg sliding down from rest on a plane incline at an angle of 300 to the horizontal. A frictional force of 6N acts between the block and the plane.
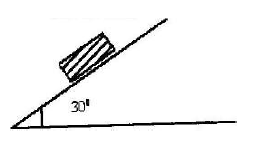
i) Copy the diagram and show the forces acting on the block.
ii) Calculate the resultant force on the block.
iii) Calculate the time taken by the block to cover the distance of 25cm.
Date posted: March 26, 2019. Answers (1)
- Figure shows a glass lens in air and its two focal points F1 and F2.(Solved)
Figure shows a glass lens in air and its two focal points F1 and F2.
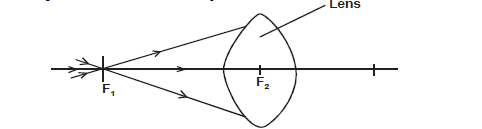
Three rays of light pass through F1 to the lens, on the figure show the path followed by the three rays through the lens and into the air.
ii) State one possible cause of myopia.
iii) State the type of lens that is used to correct myopia.
Date posted: March 26, 2019. Answers (1)
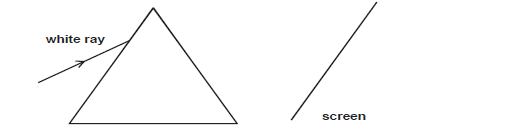
- Figure below shows a ray of light incident on a triangular prism and a white screen is placed infront of the prism.(Solved)
Figure below shows a ray of light incident on a triangular prism and a white screen is placed infront of the prism.
Date posted: March 26, 2019. Answers (1)
- A body of mass 5 kg is ejected vertically from the ground when a force of 600N acts on it for 0.1s. Calculate the velocity...(Solved)
A body of mass 5 kg is ejected vertically from the ground when a force of 600N acts on it for 0.1s. Calculate the velocity with which the body leaves the ground.
Date posted: March 26, 2019. Answers (1)
- A ray of light travels from air to glass as shown in fig below.(Solved)
A ray of light travels from air to glass as shown in fig below.
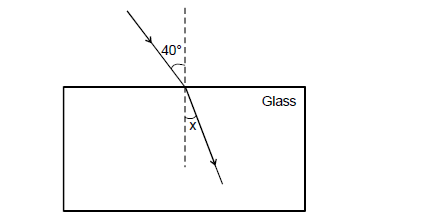
Given that the critical angle of glass is 42°. Determine the value of angle x.
Date posted: March 26, 2019. Answers (1)
- Two coins were placed at the bottom of two jars each containing a different clear liquid as shown in figure below.(Solved)
Two coins were placed at the bottom of two jars each containing a different clear liquid as shown in figure below.
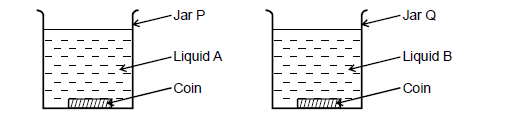
The liquids in the two jars are at the same level. The coin in jar q appears shallower than that in jar P. Explain.
Date posted: March 26, 2019. Answers (1)
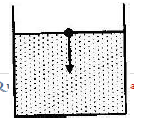
- The diagram shows a tall measuring cylinder containing a viscous liquid. A very small steel ball is released from rest at the surface of the liquid as shown(Solved)
The diagram shows a tall measuring cylinder containing a viscous liquid. A very small steel ball is released from rest at the surface of the liquid as shown. Sketch the velocity- time graph for the motion of the ball from the time it is released to the time just before it reaches the bottom of the cylinder.
Date posted: March 26, 2019. Answers (1)
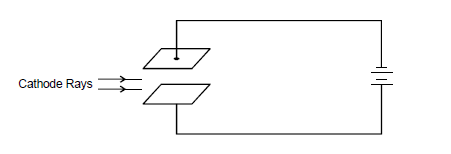
- Cathode rays are incident between two plates as shown in figure below. Complete the diagram to show the path followed by the cathode rays...(Solved)
Cathode rays are incident between two plates as shown in figure below. Complete the diagram to show the path followed by the cathode rays as they pass through the plates.
Date posted: March 26, 2019. Answers (1)
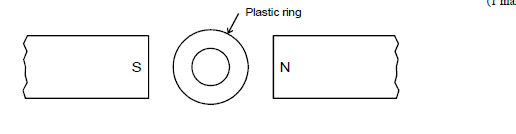
- A plastic ring is placed between two poles of a magnet as shown in figure below. Show the magnetic lines of force between the two...(Solved)
A plastic ring is placed between two poles of a magnet as shown in figure below. Show the magnetic lines of force between the two poles.
Date posted: March 26, 2019. Answers (1)