a)- A better impression of totality and individual contribution.
- Differences in quantities are easier to see.
- Easy to read the bars as they start from a common baseline.
- The value of each bar is easily determined.
b) - Kenya is not self sufficient in the commodities due to the high population.
- Frequent drought which lead to crop failure cause food shortage thus importation to supplement local produce
- Increased cost of farm inputs leading to low production hence the need to import.
- Occasional illegal imports/smuggling /hoarding of the commodities creates artificial shortage hence the need to import these commodities.
- Pests and diseases reduce the amount of grain harvested thus the need for importation.
- The requirements to maintain the trading quotas among the countries African trading blocks that Kenya imports some of the commodities in exchange of her own imports
sharon kalunda answered the question on April 17, 2019 at 08:59
- Study the table below and answer the question that follow:-(Solved)
Study the table below and answer the question that follow:-
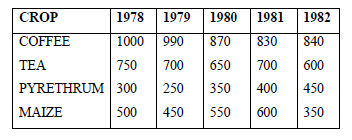
Give two disadvantages of using bar graph method to represent the above statistical data.
Date posted: April 17, 2019. Answers (1)
- Explain how Continentality influence climate.(Solved)
Explain how Continentality influence climate.
Date posted: April 17, 2019. Answers (1)
- The map of Africa below shows the different climatic regions of Africa. Use it to answer
questions below it.(Solved)
The map of Africa below shows the different climatic regions of Africa. Use it to answer
questions below it.
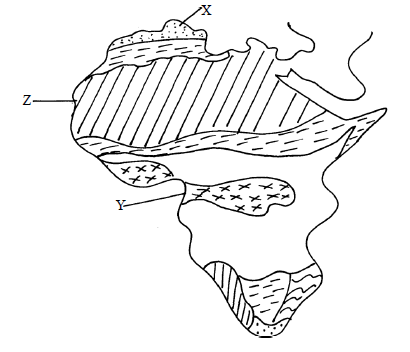
i)Identify the climatic types marked X and Y.
ii)Name any four characteristics of the climate marked Z
Date posted: April 17, 2019. Answers (1)
- Study the diagram below and name the air masses marked A, B , C and D(Solved)
Study the diagram below and name the air masses marked A, B , C and D

Key
LP- Low Pressure
HP- High Pressure
Date posted: April 17, 2019. Answers (1)
- The map below shows the climatic regions of Kenya.Use it to answer the question a and b(Solved)
The map below shows the climatic regions of Kenya.Use it to answer the question a and b
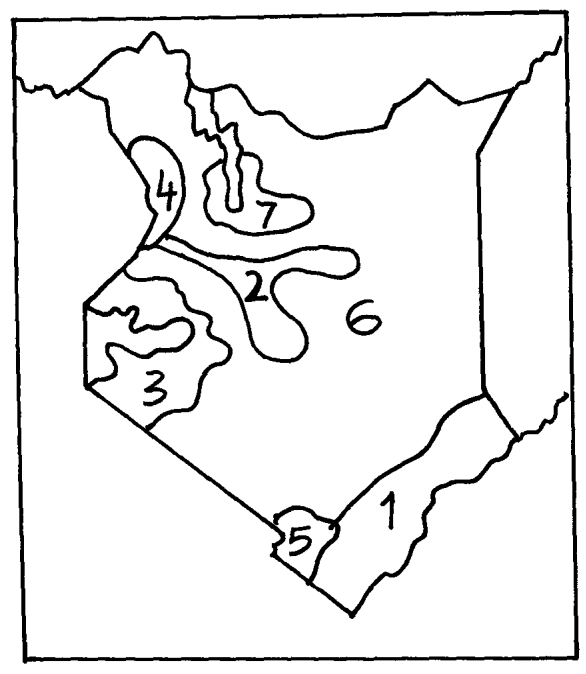
(a) Name the climatic region name 2 and 3
(b) State three characteristics of climatic region marked 7
Date posted: April 17, 2019. Answers (1)
- State two qualities that makes Stevenson screen suitable for its work(Solved)
State two qualities that makes Stevenson screen suitable for its work
Date posted: April 17, 2019. Answers (1)
- Identify with evidence two climatic aspects that could have influenced the distribution
of vegetation(Solved)
Identify with evidence two climatic aspects that could have influenced the distribution
of vegetation
Date posted: April 17, 2019. Answers (1)
- Name four Greenhouse gases(Solved)
Name four Greenhouse gases.
Date posted: April 17, 2019. Answers (1)
- What is global warming?(Solved)
What is global warming?
Date posted: April 17, 2019. Answers (1)
- Account for any four characteristics of tropical rainforests.(Solved)
Account for any four characteristics of tropical rainforests.
Date posted: April 17, 2019. Answers (1)
- What is the Inter-tropical convergence Zone?(Solved)
What is the Inter-tropical convergence Zone?
Date posted: April 17, 2019. Answers (1)
- Name two weather recording instruments that are placed in a Stevenson’s screen(Solved)
Name two weather recording instruments that are placed in a Stevenson’s screen
Date posted: April 17, 2019. Answers (1)
- What do you understand by: (i) Micro- climate (ii) Green house effect(Solved)
What do you understand by:
i) Micro- climate
ii) Green house effect
Date posted: April 17, 2019. Answers (1)
- Four classes intend to visit a weather station near your school to study the instruments for measuring weather element:-(Solved)
Four classes intend to visit a weather station near your school to study the instruments for measuring weather element:-
(i) Describe how you would use a rain gauge to measure rainfall
(ii) Name two instruments you would find inside a Stevenson screen
Date posted: April 17, 2019. Answers (1)
- State two human causes of climate change.(Solved)
State two human causes of climate change.
Date posted: April 17, 2019. Answers (1)
- Describe two characteristics of a mountain climate(Solved)
Describe two characteristics of a mountain climate
Date posted: April 17, 2019. Answers (1)
- State two climatic reasons why the government should evict settlers from the Mau forest complex in the Rift valley of Kenya.(Solved)
State two climatic reasons why the government should evict settlers from the Mau forest complex in the Rift valley of Kenya.
Date posted: April 17, 2019. Answers (1)
- Study the map of Africa below and answer the following questions:(Solved)
Study the map of Africa below and answer the following questions:
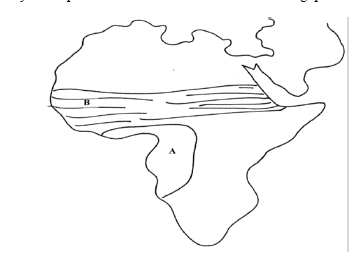
Describe the characteristics of climate marked A.
Date posted: April 17, 2019. Answers (1)
- Explain how the following factors influence climate:
(i) Ocean currents
(ii) Altitude(Solved)
Explain how the following factors influence climate:
(i) Ocean currents
(ii) Altitude
Date posted: April 17, 2019. Answers (1)
- Describe the climatic conditions experienced in the Kenya highlands(Solved)
Describe the climatic conditions experienced in the Kenya highlands
Date posted: April 17, 2019. Answers (1)