- The figure below shows a cone from which a frustum is made. A plane parallel to the base cuts the cone two thirds
way up the...(Solved)
The figure below shows a cone from which a frustum is made. A plane parallel to the base cuts the cone two thirds
way up the vertical height of the cone to form frustum ABCD. The top surface radius of the frustum is labelled r and the
bottom radius R.
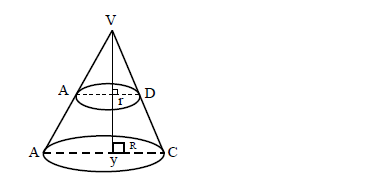
(a) Find the ratio r:R.
(b) Given that r = 7cm, find R.
(c) If the height VY of the original cone is 45cm. Calculate to the nearest whole number the volume of the
frustum. (Take 𝜋 =22/7)
(d) The frustum represents a bucket which is used to fill a rectangular tank measuring 1.5m long, 1.2m wide and
80cm high with water. How many full buckets of water are required to fill the tank.
Date posted: April 24, 2019. Answers (1)
- A group of people planned to contribute equally towards buying land at a price of Shs 180,000. However 3 members of
the group withdrew from the...(Solved)
A group of people planned to contribute equally towards buying land at a price of Shs 180,000. However 3 members of
the group withdrew from the project. As a result, each of the remaining members were to contribute KShs. 3000 more.
(a) Find the original number of members in the group.
(b) How much would each person have contributed if the 3 people had not withdrawn.
(c) Calculate the percentage increase in the contribution per person caused by the withdrawal.
Date posted: April 24, 2019. Answers (1)
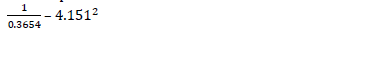
- Use reciprocal and square tables to evaluate, to 4 significant figures, the expression.(Solved)
Use reciprocal and square tables to evaluate, to 4 significant figures, the expression.
Date posted: April 24, 2019. Answers (1)
- Using logarithms tables only, evaluate.(Solved)
Using logarithms tables only, evaluate.

Date posted: April 24, 2019. Answers (1)
- The diagram below represents a right pyramid on a square base of side 3cm. The slant edge of the pyramid is 4cm.(Solved)
The diagram below represents a right pyramid on a square base of side 3cm. The slant edge of the pyramid is 4cm.

(a) Draw a labelled net of the pyramid.
(b) On the net drawn, measure the height of a triangular face from the top of the pyramid.
Date posted: April 24, 2019. Answers (1)
- A Kenyan bank buys and sells foreign currencies at the exchange rates shown below.(Solved)
A Kenyan bank buys and sells foreign currencies at the exchange rates shown below.

An American arrived in Kenya with 20 000 Euros. He converted all the Euros to Kenya shillings at the bank. He spent
KShs. 2,512,000 while in Kenya and converted the remaining Kenya shillings into US Dollars at the bank. Find the
amount in Dollars that he received.
Date posted: April 24, 2019. Answers (1)
- The line which joins the point A (3, k) and B (-2, 5) is parallel to the line whose equation is
5y + 2x – 7...(Solved)
The line which joins the point A (3, k) and B (-2, 5) is parallel to the line whose equation is
5y + 2x – 7 = 0. Find the value of k.
Date posted: April 24, 2019. Answers (1)
- A mother is now 2.5times as old as her daughter Mary. Four years ago the ratio of their ages was 3:1. Find the present
age of...(Solved)
A mother is now 2.5times as old as her daughter Mary. Four years ago the ratio of their ages was 3:1. Find the present
age of the mother.
Date posted: April 24, 2019. Answers (1)
- Simplify the following.(Solved)
Simplify the following.

Date posted: April 24, 2019. Answers (1)
- A cylinder of radius 14cm contains water. A metal solid cone of base radius 7cm and height 18cm is submerged into
the water. Find the change...(Solved)
A cylinder of radius 14cm contains water. A metal solid cone of base radius 7cm and height 18cm is submerged into
the water. Find the change in height of the water level in cylinder.
Date posted: April 24, 2019. Answers (1)
- A salesman is paid a salary of Sh. 10,000 per month. He is also paid a commission on sales above Sh. 100,000. In one
month he...(Solved)
A salesman is paid a salary of Sh. 10,000 per month. He is also paid a commission on sales above Sh. 100,000. In one
month he sold goods worth Sh. 500,000. If his total earning that month was Sh. 56,000. Calculate the rate of
commission.
Date posted: April 24, 2019. Answers (1)
- The interior angle of a regular polygon is 1080 larger than the exterior angle. How many sides has the polygon?(Solved)
The interior angle of a regular polygon is 1080 larger than the exterior angle. How many sides has the polygon?
Date posted: April 24, 2019. Answers (1)
- The figure below shows quadrilateral ABCD in which AB = 6cm. BC =1/2CD, CD = DA and angle ADC = angle BCD = 900.(Solved)
The figure below shows quadrilateral ABCD in which AB = 6cm. BC =1/2CD, CD = DA and angle ADC = angle BCD = 900.

Calculate the area of the quadrilateral ABCD.
Date posted: April 24, 2019. Answers (1)
- Three sirens wail at intervals of thirty minutes, fifty minutes and thirty-five minutes. If they wail together at 7.18 a.m. on
Monday, what time and day...(Solved)
Three sirens wail at intervals of thirty minutes, fifty minutes and thirty-five minutes. If they wail together at 7.18 a.m. on
Monday, what time and day will they wail together?
Date posted: April 24, 2019. Answers (1)
- Find the value of x if(Solved)
Find the value of x if

Date posted: April 24, 2019. Answers (1)
- Without using a calculator or mathematical tables simplify.(Solved)
Without using a calculator or mathematical tables simplify.

Date posted: April 24, 2019. Answers (1)
- Evaluate without using a calculator.(Solved)
Evaluate without using a calculator.

Date posted: April 24, 2019. Answers (1)
- A circular lawn is surrounded by a path of a uniform width of 7 meters. The area of the path is 21% that of the...(Solved)
A circular lawn is surrounded by a path of a uniform width of 7 meters. The area of the path is 21% that of the lawn. Calculate the radius of the lawn.
Date posted: April 23, 2019. Answers (1)
- A liquid spray of 384g is packed in a cylinder container of internal radius 3.2cm. Given that the density of the liquid is 0.6g/cm3, calculate...(Solved)
A liquid spray of 384g is packed in a cylinder container of internal radius 3.2cm. Given that the density of the liquid is 0.6g/cm3, calculate to 2 decimal places the height of the liquid in the container
Date posted: April 21, 2019. Answers (1)
- Mueni bought maize and beans at sh 20 per kg and sh 50 per kg respectively. She mixed them in a ratio such that after...(Solved)
Mueni bought maize and beans at sh 20 per kg and sh 50 per kg respectively. She mixed them in a ratio such that after selling the mixture at sh 39 per kg, she made a profit of 50%. Find the ratio in which she mixed them.
Date posted: April 6, 2019. Answers (1)