- The diagram below shows a right pyramid VPQRS with V as the vertex and a rectangular base PQRS. PQ = 3cm, QR =4cm. The height...(Solved)
The diagram below shows a right pyramid VPQRS with V as the vertex and a rectangular base PQRS. PQ = 3cm, QR =4cm. The height of the pyramid is 6cm.PM = MQ and OQ = NR.
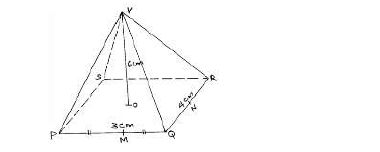
(a) Calculate.
(i) the length PV.
(ii) the angle between face VPQ and the base.
(b) (i) the slant height VM and VN.
(ii) What is the surface area of the pyramid?
Date posted: April 25, 2019. Answers (1)
- In the figure below AOC is a diameter of the circle centre O. AB = BC and Angle ACD = 350, EBF is a tangent...(Solved)
In the figure below AOC is a diameter of the circle centre O. AB = BC and Angle ACD = 350, EBF is a tangent to the circle at B. G is a point on minor arc CD.
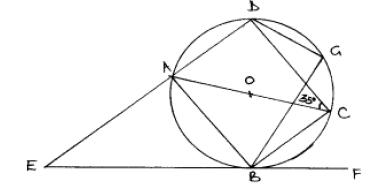
Calculate the size of the following angles giving reasons in each case.
(a) Angle BCD.
(b) Obtuse angle BOD.
(c) Angle BAD.
(d) Angle CGD.
(e) Angle AEB.
Date posted: April 25, 2019. Answers (1)
- Two towns A and B lie on the same parallel of latitudes 600N. If the longitudes of A and B are 420W and 290E respectively.(Solved)
Two towns A and B lie on the same parallel of latitudes 600N. If the longitudes of A and B are 420W and 290E respectively.
(a) Find the distance between A and B in nautical miles along the parallel of latitude.
(b) Find the local time at A if at B is 1.00pm.
(c) Find the distance between A and B in km.
(d) If C is another town due South of A and 10010km away from A, Find the co-ordinate of C.
Date posted: April 25, 2019. Answers (1)
- In below figure PT = 4cm and TQ = 5cm and TS = 2.5cm find TR by calculation.(Solved)
In below figure PT = 4cm and TQ = 5cm and TS = 2.5cm find TR by calculation.
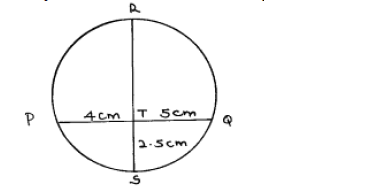
Date posted: April 25, 2019. Answers (1)
- A car valued at Ksh.500,000 in January 2008. Each year, it value depreciates at 12%p.a. Find after how long would the
value depreciate to Ksh.250,000.(Solved)
A car valued at Ksh.500,000 in January 2008. Each year, it value depreciates at 12%p.a. Find after how long would the
value depreciate to Ksh.250,000.
Date posted: April 25, 2019. Answers (1)
- Given that AB = 6cm construct locus of P such that angle APB = 90.(Solved)
Given that AB = 6cm construct locus of P such that angle APB = 90.

Date posted: April 25, 2019. Answers (1)
- Simplify:(Solved)
Simplify: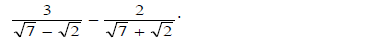
Date posted: April 25, 2019. Answers (1)
- The gradient of a curve at any point given by 2X - 1. Given that the curve passes through point (1, 5). Find the
equation of...(Solved)
The gradient of a curve at any point given by 2X - 1. Given that the curve passes through point (1, 5). Find the
equation of the curve.
Date posted: April 25, 2019. Answers (1)
- The population of two town Kana and Jane for three years were as follows:(Solved)
The population of two town Kana and Jane for three years were as follows:

Calculate the difference in population of the two after six years.
Date posted: April 25, 2019. Answers (1)
- A dam containing 4158m³ of water is to be drained. A pump is connected to a pipe of radius 3.5cm and machine operate for 8...(Solved)
A dam containing 4158m³ of water is to be drained. A pump is connected to a pipe of radius 3.5cm and machine operate for 8 hours per day. Water flows through the pipe at the rate of 1.5m per second. Find the number of days it takes to drain the dam.
Date posted: April 25, 2019. Answers (1)
- A two digit number is formed from the first four prime numbers.(Solved)
A two digit number is formed from the first four prime numbers.
(a) Draw the table to show the possible outcomes.
(b) Calculate the probability that a number chosen from the two digits is even number.
Date posted: April 25, 2019. Answers (1)
- Find C that divide AB externally in the ratio 5: 2, given that(Solved)
Find C that divide AB externally in the ratio 5: 2, given that
A (3, -6, 9) and B (-15, 3, 12).
Date posted: April 25, 2019. Answers (1)
- Points P, Q and R are points on the circumference of a circle. If PQ = PR = 13cm and QR = 10cm, what is...(Solved)
Points P, Q and R are points on the circumference of a circle. If PQ = PR = 13cm and QR = 10cm, what is the radius of
the circle.
Date posted: April 25, 2019. Answers (1)
- Make P the subject of the formula.(Solved)
Make P the subject of the formula.
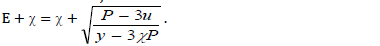
Date posted: April 25, 2019. Answers (1)
- Solve for y in the equation.(Solved)
Solve for y in the equation.

Date posted: April 25, 2019. Answers (1)
- (a) Expand(Solved)
(a) Expand 
(b) Use the expansion in (a) above to. Find the value (2.01)4 to 4d.p.
Date posted: April 25, 2019. Answers (1)
- Simplify:(Solved)
Simplify: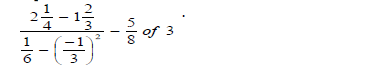
Date posted: April 25, 2019. Answers (1)
- The mass of a mixture A of beans and maize is 72kg. The ratio of beans to maize is 3: 5 respectively. Find the mass...(Solved)
The mass of a mixture A of beans and maize is 72kg. The ratio of beans to maize is 3: 5 respectively. Find the mass of
maize in the mixture.
Date posted: April 25, 2019. Answers (1)
- An Arc of a circle of radius 40cm subtends an angle of 1260 at the centre of the circle.(Solved)
An Arc of a circle of radius 40cm subtends an angle of 1260 at the centre of the circle.
(a) Calculate:
(i) the length of the arc.
(ii) the area of the sector.
(b) The sector is folded to form a cone.
Calculate:
(i) the radius of the base of the cone.
(ii) the height of the cone.
(iii) the capacity of the cone in litres.
Date posted: April 25, 2019. Answers (1)
- In the figure below,(Solved)
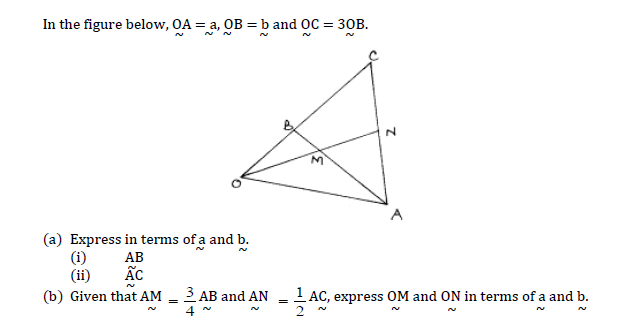
(c) Hence show that O, M and N are collinear.
Date posted: April 25, 2019. Answers (1)