- Kamdara and Jet are two towns 320 kilometres apart. A bus left A at 8.00 am travelling at 60km/h for town B. After
forty minutes, a...(Solved)
Kamdara and Jet are two towns 320 kilometres apart. A bus left A at 8.00 am travelling at 60km/h for town B. After
forty minutes, a saloon car left A travelling in the same direction as the bus at a speed of 80km/h.
a) How far from B did the saloon car catch up with the bus?
b) At what time did it catch up with the bus?
c) When the saloon caught up with the bus it got a break – down and had to be repaired before proceeding to B at the
same speed. If they both reached at B at the same time, find how long it took to repair the saloon?
Date posted: April 30, 2019. Answers (1)
- a) Draw on graph paper triangle ABC, whose vertices are A(0,12), B(6,0) and C(12,18). Draw the line of symmetry
for triangle ABC and write down its...(Solved)
a) Draw on graph paper triangle ABC, whose vertices are A(0,12), B(6,0) and C(12,18). Draw the line of symmetry
for triangle ABC and write down its equation
b) Draw A’B’C’, the image of ABC, under reflection in the line y - x = 0
c) Write down the coordinates of the two points which are invariant under this transformation
d) Determine the centre of rotation which maps A’B’C’ onto ACB
Date posted: April 30, 2019. Answers (1)
- The height of a wooden solid cone is 45cm and its curved surface area is four times the area of the base. Calculate:(Solved)
The height of a wooden solid cone is 45cm and its curved surface area is four times the area of the base. Calculate:
a) The radius of of the base
b) The total surface area of the cone.
c) The volume of the cone
Date posted: April 30, 2019. Answers (1)
- An enlargement with centre (-2,3) maps (1,0) onto (4,-3). What is the image of (-3,-6) with the same centre of enlargement(Solved)
An enlargement with centre (-2,3) maps (1,0) onto (4,-3). What is the image of (-3,-6) with the same centre of enlargement
Date posted: April 30, 2019. Answers (1)
- A car uses 1 litre of petrol for every 8 kilometres. The car was to travel 480 kilometres and had 15 litre of petrol at...(Solved)
A car uses 1 litre of petrol for every 8 kilometres. The car was to travel 480 kilometres and had 15 litre of petrol at the beginning of the journey. Each litre of petrol cost sh. 112.00. How much did it cost for the extra petrol added?
Date posted: April 30, 2019. Answers (1)
- Timmons sold a TV set costing Ksh. 47,000 at a profit of 20%. He earned a commission of 22.5 % on the profit. Find the...(Solved)
Timmons sold a TV set costing Ksh. 47,000 at a profit of 20%. He earned a commission of 22.5 % on the profit. Find the commission he earned.
Date posted: April 30, 2019. Answers (1)
- If x:y = 9:11, find the ratio of (5x - 3y):(2x + 3y)(Solved)
If x:y = 9:11, find the ratio of (5x - 3y):(2x + 3y).
Date posted: April 30, 2019. Answers (1)
- A straight line through the points A (2,1) and B (4,m) is perpendicular to the line whose equation is 3y = 5-2x.
Determine the value of...(Solved)
A straight line through the points A (2,1) and B (4,m) is perpendicular to the line whose equation is 3y = 5-2x.
Determine the value of m and it's equation.
Date posted: April 30, 2019. Answers (1)
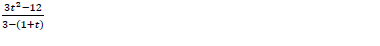
- Simplify the expression below.(Solved)
Simplify the expression below.
Date posted: April 30, 2019. Answers (1)
- Solve for x in the equation 3x+1 + 3 + 3 + 30 = 109(Solved)
Solve for x in the equation 3x+1 + 3?? + 30 = 109
Date posted: April 30, 2019. Answers (1)
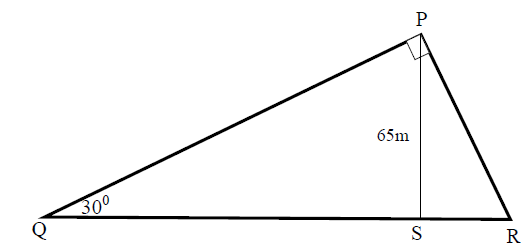
- The figure below represents a right-angled triangular plot of land PQR. PS is perpendicular to BC. If angle PQR = 300
and PS = 6.5cm, find...(Solved)
The figure below represents a right-angled triangular plot of land PQR. PS is perpendicular to BC. If angle PQR = 300
and PS = 6.5cm, find the area of the plot.
Date posted: April 30, 2019. Answers (1)
- Solve 4x -3 = 6x -1< 3x + 16 and list all the integral values of x.(Solved)
Solve 4x -3 ≤ 6x -1< 3x + 16 and list all the integral values of x.
Date posted: April 30, 2019. Answers (1)
- The exterior angle of a regular polygon is 240. Determine the sum of the interior angles.(Solved)
The exterior angle of a regular polygon is 240. Determine the sum of the interior angles.
Date posted: April 30, 2019. Answers (1)
- The price of foodstuff generally increased by 20% at the beginning of a drought season and reduced by 30% during
harvest season. Express the new price...(Solved)
The price of foodstuff generally increased by 20% at the beginning of a drought season and reduced by 30% during
harvest season. Express the new price as a ratio of the original price in its lowest form
Date posted: April 30, 2019. Answers (1)
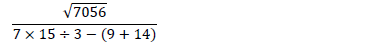
- Without using tables or calculator, evaluate(Solved)
Without using tables or calculator, evaluate
Date posted: April 30, 2019. Answers (1)
- What is the formula for finding the area of a rectangle?(Solved)
What is the formula for finding the area of a rectangle?
Date posted: April 29, 2019. Answers (1)
- The product of the first three terms of a geometric progression is 64. If the first term is a and the common ratio is r,(Solved)
The product of the first three terms of a geometric progression is 64. If the first term is a and the common ratio is r,
a) Express r in terms of a
b) Given that the sum of the three terms is 14;
i) Calculate the values of a and r and hence write down two possible sequences each up to the 4th term
ii) Find the product of the 50th terms of the two sequences
Date posted: April 29, 2019. Answers (1)
- The length of a floor of a rectangular hall is 9m more than its width. The area of the floor is 136m2.
(Solved)
The length of a floor of a rectangular hall is 9m more than its width. The area of the floor is 136m2.
(i) Calculate the perimeter of the floor
(ii) A rectangular carpet is placed on the hall leaving an area of 64cm2. If the length of the carpet is twice its width,determine the width of the carpet
Date posted: April 29, 2019. Answers (1)
- Three quantities R, S, T are such that R varies directly as S and inversely as the square of T.(Solved)
Three quantities R, S, T are such that R varies directly as S and inversely as the square of T.
(a) Given that R = 480 when S = 150 and T = 5, write an equation connecting R, S and T
(b) (i) Find the value of R when S = 360 and T = 1.5
(ii) Find the percentage change in R if S increases by 5% and T decreases by 20%
Date posted: April 29, 2019. Answers (1)
- The table below shows income tax rates for a certain year.(Solved)
The table below shows income tax rates for a certain year.
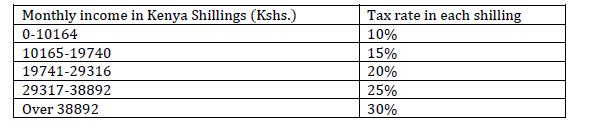
A tax relief of Kshs. 1162 per month was allowed. In a certain month of the year, an employee’s taxable income in the
fifth band was Kshs. 2108.
a) Calculate:
i) Employees total taxable income in that month
ii) The tax payable by the employee in that month
b) The employees income includes a house allowance of Kshs. 15,000 per month. The employees contributed 5% basic
salary to a cooperative society. Calculate the employees net pay for that month.
Date posted: April 29, 2019. Answers (1)