- The figure below is a cone whose base radius is 7cm and slant height 14cm. The net of the cone is a sector of a...(Solved)
The figure below is a cone whose base radius is 7cm and slant height 14cm. The net of the cone is a sector of a circle.
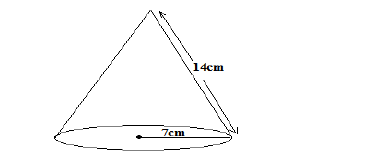
a) Find the angle substended at the centre of the sector.
b) Draw the net of the solid.
Date posted: May 3, 2019. Answers (1)
- Solve the simultaneous inequalities and represent the solution on a number line; 4 - 2x < 8 and 2 - 3x = - 7(Solved)
Solve the simultaneous inequalities and represent the solution on a number line; 4 - 2x < 8 and 2 - 3x ≥ - 7
Date posted: May 3, 2019. Answers (1)
- Given that a = 5i + 4j, b = 3i - 2j and c = 7i + 10j; find the scalars m and n such...(Solved)
Given that a = 5i + 4j, b = 3i - 2j and c = 7i + 10j; find the scalars m and n such that ma + nb = c
Date posted: May 3, 2019. Answers (1)
- In the figure below O is the centre of the circle diameter AB. 0, AX = 4cm and PX = 10cm.
Calculate the radius...(Solved)
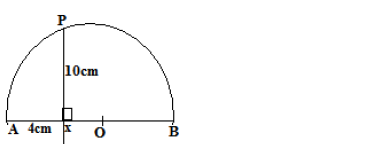
In the figure below O is the centre of the circle diameter AB. 0, AX = 4cm and PX = 10cm.
Calculate the radius of the semi-circle.
Date posted: May 3, 2019. Answers (1)
- Kairietu is now four times as old as her daughter and six times as old as her son. Twelve years from now, the sum of
the...(Solved)
Kairietu is now four times as old as her daughter and six times as old as her son. Twelve years from now, the sum of
the ages of her daughter and son will differ from her age by 9 years. What is Kairietu’s present age?
Date posted: May 3, 2019. Answers (1)
- A square whose vertices are P(1, 1), Q(2, 1), R(2, 2) and S(1, 2) is given an enlargement with centre at (0, 0).
Find the images...(Solved)
A square whose vertices are P(1, 1), Q(2, 1), R(2, 2) and S(1, 2) is given an enlargement with centre at (0, 0).
Find the images of the vertices if the scale factor is 3.
Date posted: May 3, 2019. Answers (1)
- The cash price of a music system is kshs. 30,000. It can be bought under hire purchase terms by paying a deposit of
kshs. 10,000 and...(Solved)
The cash price of a music system is kshs. 30,000. It can be bought under hire purchase terms by paying a deposit of
kshs. 10,000 and twelve monthly installments of Kshs. 3,200 per month. Determine the percentage rate of interest per
month.
Date posted: May 3, 2019. Answers (1)
- A colony of insects was found to have 250 insects at the beginning. Thereafter, the number of insects doubled
every two days. Find the number of...(Solved)
A colony of insects was found to have 250 insects at the beginning. Thereafter, the number of insects doubled
every two days. Find the number of insects after 16 days.
Date posted: May 3, 2019. Answers (1)
- In the figure below, O is the centre of the circle. PQ is parallel to OR and PQO = 400, find (Solved)
In the figure below, O is the centre of the circle. PQ is parallel to OR and PQO = 400, find 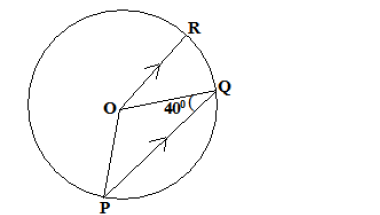
Date posted: May 3, 2019. Answers (1)
- Given that Sin x = 3/4 find without using tables or calculators.(Solved)
Given that Sin x = 3/4 find without using tables or calculators.
a) Cos x
b) Tan (90 - x)
Date posted: May 3, 2019. Answers (1)
- Kanyan toured Switzerland from Germany. In Switzerland he bought his wife a present worth 72 Deutsche marks.
Find the value of the present in(Solved)
Kanyan toured Switzerland from Germany. In Switzerland he bought his wife a present worth 72 Deutsche marks.
Find the value of the present in
a) Swiss Francs
b) Kenya shillings correct to the nearest sh, if
1 Swiss Franc = 1.25 Deutsche marks
1 Swiss Franc = 48.2 Kenya shillings
Date posted: May 3, 2019. Answers (1)
- A polygon of n sides has half of the interior angles 1500 each and the rest 1700 each. Find the value of n.(Solved)
A polygon of n sides has half of the interior angles 1500 each and the rest 1700 each. Find the value of n.
Date posted: May 3, 2019. Answers (1)
- If 2/3 is added to the numerator of a certain fraction the fraction will be increased by 1/21 and if 1/2 is deducted
from its denominator...(Solved)
If 2/3 is added to the numerator of a certain fraction the fraction will be increased by 1/21 and if 1/2 is deducted
from its denominator that fraction becomes 2/9. Find the reciprocal of the fraction.
Date posted: May 3, 2019. Answers (1)
- Simplify the expression.(Solved)
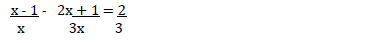
Simplify the expression.

Hence solve the equation
Date posted: May 3, 2019. Answers (1)
- Simplify completely(Solved)
Simplify completely
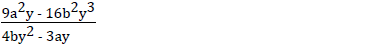
Date posted: May 3, 2019. Answers (1)
- The position of two towns A and B on earth surface are (360N, 490E) and (360N, 1310W) respectively.Take R = 6370(Solved)
The position of two towns A and B on earth surface are (360N, 490E) and (360N, 1310W) respectively.Take R = 6370
a) Find the difference in longitude between the town A and B.
b) Calculate the distance between A and B along the latitude in
i) nautical miles
ii) kilometres
c) i) Another town C is 840km East of town B and on the same latitude as town A and B . Find the position of town C.
ii) If the local time in B is 7.30 a.m, find the local time in C.
Date posted: May 3, 2019. Answers (1)
- A particle moving along a line passes a point O at a velocity of 15m/s and its acceleration t seconds later is given by
a=...(Solved)
A particle moving along a line passes a point O at a velocity of 15m/s and its acceleration t seconds later is given by
a= (2t - 8) m/s2
a) Find the expression of the velocity after passing the point O.
b) Find the time when the particle is at rest.
c) Find the distance between the points when the particle is at rest.
Date posted: May 3, 2019. Answers (1)
- The first, third and sixth terms of an arithmetic progression (AP) correspond to the first three consecutive terms of a
geometric progression (GP). The first term...(Solved)
The first, third and sixth terms of an arithmetic progression (AP) correspond to the first three consecutive terms of a
geometric progression (GP). The first term of each progression is 16, common difference of AP and d and common
ratio of the GP is r.
a) i) Write two equations involving d and r.
ii) Find the values of d and r.
b) Find the sum of the first 20 terms in the
i) Arithmetic progression (AP).
ii) Geometric progression (GP)
Date posted: May 3, 2019. Answers (1)
- The probability of three dart players Githongo, Mwai and Kanyoro hitting the bulls eye in a competition are 0.4, 0.7
and 0.5 respectively.(Solved)
The probability of three dart players Githongo, Mwai and Kanyoro hitting the bulls eye in a competition are 0.4, 0.7
and 0.5 respectively.
a) Draw a probability tree diagrams to show the possible outcomes.
b) Find the probability that
i) all hit the bulls eye.
ii) only one of them hit the bulls eye.
iii) atmost one missed the bulls eye.
Date posted: May 3, 2019. Answers (1)
- A company is to construct a parking bay whose area is 135m2. It is to be covered with a concrete slab of uniform
thickness of 150mm....(Solved)
A company is to construct a parking bay whose area is 135m2. It is to be covered with a concrete slab of uniform
thickness of 150mm. To make the slab, cement, ballast and sand are to be mixed so that their masses are in the ratio 1 :4 : 4. The mass of 1m3 of dry slab is 2500kg. Calculate
a) i) the volume of the slab.
ii) the mass of the dry slab.
iii) the mass of cement to be used.
b) If one bag of cement is 50kg, find the number of bags to be purchased.
c) If a lorry carries 7 tonnes of sand, calculate the number of lorries of sand to be purchased.
Date posted: May 3, 2019. Answers (1)