- Given a:b = 6:7 and b:c = 14.17 find a:b:c.(Solved)
Given a:b = 6:7 and b:c = 14.17 find a:b:c.
Date posted: May 3, 2019. Answers (1)
- Ruto is 12 years old. In three years time he will be 1/3 of his father’s present age. How old was his father 12 years...(Solved)
Ruto is 12 years old. In three years time he will be 1/3 of his father’s present age. How old was his father 12 years ago.
Date posted: May 3, 2019. Answers (1)
- Vectors A and B are 2i + 5i and 8i – 7j respectively. Find the coordinates of M which divide AB in the ratio 1:2.(Solved)
Vectors A and B are 2i + 5i and 8i – 7j respectively. Find the coordinates of M which divide AB in the ratio 1:2.
Date posted: May 3, 2019. Answers (1)
- Solve the simultaneous equations.
(Solved)
Solve the simultaneous equations.
xy = 4
x + y = 5
Date posted: May 3, 2019. Answers (1)
- Find the equation of the perpendicular bisector of line AB where A is (3, 9) and B(7,5) giving your answer in the form
ax + by...(Solved)
Find the equation of the perpendicular bisector of line AB where A is (3, 9) and B(7,5) giving your answer in the form
ax + by + c = 0
Date posted: May 3, 2019. Answers (1)
- From a viewing tower 30 metres above the ground, the angle of depression of an object on the ground is 30o and the
angle of elevation...(Solved)
From a viewing tower 30 metres above the ground, the angle of depression of an object on the ground is 30o and the
angle of elevation of an aircraft vertically above the object is 42o. Calculate the height of the aircraft above the ground.
Date posted: May 3, 2019. Answers (1)
- If x = 2/3 is a root of 6x2 + kx – 2 = 0, find the value of k and the other root.(Solved)
If x = 2/3 is a root of 6x2 + kx – 2 = 0, find the value of k and the other root.
Date posted: May 3, 2019. Answers (1)
- Tap A takes 4 minutes to fill a tank and tap B takes 6 minutes to empty the tank. If the tank has a capacity...(Solved)
Tap A takes 4 minutes to fill a tank and tap B takes 6 minutes to empty the tank. If the tank has a capacity of 3000 litres find the volume of the tank after 2 minutes when both taps are open.
Date posted: May 3, 2019. Answers (1)
- Rose bought a golden necklace for ksh.6000 and sold it to Betty at a loss of 30%. Betty later sold it at a profit of...(Solved)
Rose bought a golden necklace for ksh.6000 and sold it to Betty at a loss of 30%. Betty later sold it at a profit of 20%.
What was Betty’s selling price.
Date posted: May 3, 2019. Answers (1)
- Solve the following inequality and show your solution on a number line.(Solved)
Solve the following inequality and show your solution on a number line.
4x – 3 ≤ ½ (x + 8) < x + 5
Date posted: May 3, 2019. Answers (1)
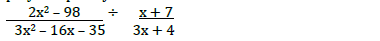
- Simplify completely(Solved)
Simplify completely
Date posted: May 3, 2019. Answers (1)
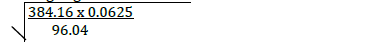
- Without using Logarithms tables or a calculator evaluate.(Solved)
Without using Logarithms tables or a calculator evaluate.
Date posted: May 3, 2019. Answers (1)
- The headteacher of a secondary school placed an order for x - lockers and y - chairs from a metal works with the
following conditions:(Solved)
The headteacher of a secondary school placed an order for x - lockers and y - chairs from a metal works with the
following conditions:
i) The number of chairs should be more than the number of lockers.
ii) The total number of lockers and chairs must not exceed 100.
iii) There should be at least 20 chairs and not less than 10 lockers.
iv) The cost of a locker is ksh. 2500 and that of a chair is ksh. 1000 and the headteacher has only ksh. 1500 to spend
on lockers and chairs during the term.
a) Write down all the inequalities describing the situation above.
b) On the grid provided, draw a graph representing the inequalities.
c) Determine the maximum number of lockers and chairs that can be bought.
Date posted: May 3, 2019. Answers (1)
- A plane S flies from a point P (400N, 450W) to a point Q(350N, 450W) and then onto a point T (350N, 1350E).(Solved)
A plane S flies from a point P (400N, 450W) to a point Q(350N, 450W) and then onto a point T (350N, 1350E).
a) Given that the radius of the earth is 6370km, find the distance P to Q in km.
b) Find in nm;
i) the shortest distance between Q and T.
ii) the longest distance between Q and T (to the nearest tens).
c) Find the difference in time taken when S flies along the shortest and longest routes if its speed is 420 knots.
Date posted: May 3, 2019. Answers (1)
- A bag, contains 5 blue balls, 8 red balls and 3 green balls being similar in shape and size. A ball is picked out at
random...(Solved)
A bag, contains 5 blue balls, 8 red balls and 3 green balls being similar in shape and size. A ball is picked out at
random without replacement and it’s colour noted. Use a tree diagram to determine the probability that at least
one of first two balls picked is green.
Date posted: May 3, 2019. Answers (1)
- In a F4 class there are 22 girls and 18 boys. The probability that a girl completes the secondary education course is
3/5 whereas that of...(Solved)
In a F4 class there are 22 girls and 18 boys. The probability that a girl completes the secondary education course is
3/5 whereas that of a boy is 2/3. A student is picked at random from the class. Find the probability that the student picked:
i) Is a boy and will complete the course.
ii) Will complete the course.
Date posted: May 3, 2019. Answers (1)
- The table below shows the income tax rates for a certain year.(Solved)
The table below shows the income tax rates for a certain year.
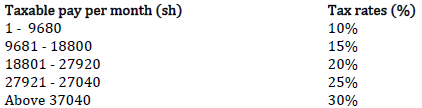
In that year Maina paid a net tax of ksh. 5512 per month. His total monthly taxable allowances amounted to ksh.
15,220 and he was entitled to a monthly personal relief of ksh. 1162. Every month the following deductions were made
- NHIF Ksh. 320
- Union dues Ksh. 200
- Co-op shares Ksh. 7500
a) Calculate Maina’s monthly basic salary in Ksh.
b) Calculate his monthly net salary.
Date posted: May 3, 2019. Answers (1)
- In a botanical experiment, the length of 60 leaves of a certain type of a tree were measured correct to the nearest
0.1cm.(Solved)
In a botanical experiment, the length of 60 leaves of a certain type of a tree were measured correct to the nearest
0.1cm.

a) State the modal class.
b) Calculate the median length.
c) Using a working mean of 5.2, find
i) The mean.
ii) The standard deviation.
Date posted: May 3, 2019. Answers (1)
- In the triangle OAB below, OA = a, OB = b and OC = 3/2OA. M divided OB in the ratio 3:2.(Solved)
In the triangle OAB below, OA = a, OB = b and OC = 3/2OA. M divided OB in the ratio 3:2.
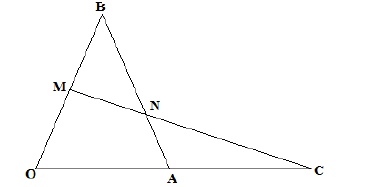
a) Express in terms of a and b only, the vectors
i) BA
ii) MC
b) Given further that MN = hMC and BN = kBA, express vector MN in two different ways and hence, find the value of h and k.
c) Show that the points M, N and C are collinear.
Date posted: May 3, 2019. Answers (1)
- Find the exact area of the shaded region.(Solved)
Find the exact area of the shaded region.
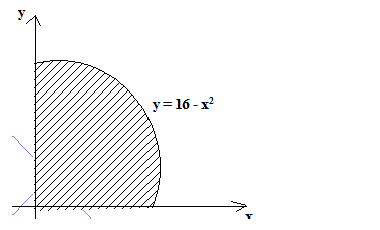
Date posted: May 3, 2019. Answers (1)