- X and Y are two variables such that Y is partly constant and partly varies inversely as the square of X. If Y = 3...(Solved)
X and Y are two variables such that Y is partly constant and partly varies inversely as the square of X. If Y = 3 when X= 2 and Y = 5 when X = 1, find Y when X = 4.
Date posted: May 6, 2019. Answers (1)
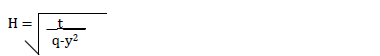
- Make y the subject of the formula given(Solved)
Make y the subject of the formula given
Date posted: May 6, 2019. Answers (1)
- The equation of a circle centre (h, k) is 2x2 + 2y2– 8x + 5y + 10 = 0. Find the values of h and...(Solved)
The equation of a circle centre (h, k) is 2x2 + 2y2– 8x + 5y + 10 = 0. Find the values of h and k.
Date posted: May 6, 2019. Answers (1)
- Find the midpoint of the straight line joining A (2, 1) and D (6,5).(Solved)
Find the midpoint of the straight line joining A (2, 1) and D (6,5).
Date posted: May 6, 2019. Answers (1)
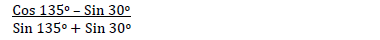
- Without using mathematical tables or calculator; evaluate:(Solved)
Without using mathematical tables or calculator; evaluate:
Date posted: May 6, 2019. Answers (1)
- Find the equation of the normal to the tangent of the curve y=x3 – 3x2 + 2x + 1 at the point where x=3. Leave...(Solved)
Find the equation of the normal to the tangent of the curve y=x3 – 3x2 + 2x + 1 at the point where x=3. Leave your answer in the form y=mx + c.
Date posted: May 6, 2019. Answers (1)
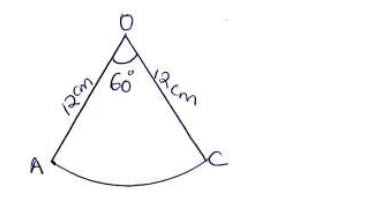
- The sector below has a radius of 12cm and an angle AOC = 60o is folded to form a cone. Find the volume of the...(Solved)
The sector below has a radius of 12cm and an angle AOC = 60o is folded to form a cone. Find the volume of the cone
formed.
Date posted: May 6, 2019. Answers (1)
- P and Q are two points such that OP = i + 2j + 3k and OQ = 4i + 5j – 3k. M is...(Solved)
P and Q are two points such that OP = i + 2j + 3k and OQ = 4i + 5j – 3k. M is a point that divides PQ externally in the
ratio 3:2. Find the co-ordinates of M.
Date posted: May 6, 2019. Answers (1)
- Find the variance and standard deviation of 3, 5, 7, 9, 11(Solved)
Find the variance and standard deviation of 3, 5, 7, 9, 11
Date posted: May 6, 2019. Answers (1)
- Using a ruler and a pair of compasses only construct a triangle PQR in which QR is 6.6cm, P=3.8cm and PQ = 5.6cm.Locate point x...(Solved)
Using a ruler and a pair of compasses only construct a triangle PQR in which QR is 6.6cm, P=3.8cm and PQ = 5.6cm.Locate point x inside triangle PQR which is equidistant from P and R such that angle PXR = 90o.
Date posted: May 6, 2019. Answers (1)
- Under a shear with x-axis invariant a square with vertices A(1,0), B(3,0), C(3,2) and D(1,2) is mapped onto a
parallelogram with vertices A1(1,0) B1(3,0), C1(7,2) and...(Solved)
Under a shear with x-axis invariant a square with vertices A(1,0), B(3,0), C(3,2) and D(1,2) is mapped onto a
parallelogram with vertices A1(1,0) B1(3,0), C1(7,2) and D1(5,2). Find the shear matrix.
Date posted: May 6, 2019. Answers (1)
- A radio cassette is offered for sale at shs 8,000 or a deposit of shs. 1,000 and 15 monthly repayments of shs 840. Find the...(Solved)
A radio cassette is offered for sale at shs 8,000 or a deposit of shs. 1,000 and 15 monthly repayments of shs 840. Find the rate of interest compounded monthly that is being charged under hire purchase terms.
Date posted: May 6, 2019. Answers (1)
- Solve for x in the equation(Solved)
Solve for x in the equation
Sin(4x - 10)o – Cos (x + 60)o = 0
Date posted: May 6, 2019. Answers (1)
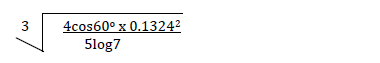
- Use mathematical tables to evaluate.(Solved)
Use mathematical tables to evaluate.
Date posted: May 6, 2019. Answers (1)
- A particle P moves in a straight line such that t seconds after passing a fixed point Q. it’s velocity is given by the
equation 2t3...(Solved)
A particle P moves in a straight line such that t seconds after passing a fixed point Q. it’s velocity is given by the
equation 2t3 -10t + 12 find:
a) The values of t when p is instantaneously at rest.
b) An expression for the distance moved by P after t seconds.
c) The total distance traveled by P in the first 3 seconds after passing point O.
d) The distance of P from O when acceleration is zero.
Date posted: May 6, 2019. Answers (1)
- A tailor bought a number of suits at a cost of sh.57,000 from Ken-suit wholesalers. Had he bought the same number of
suits from Umoja wholesalers...(Solved)
A tailor bought a number of suits at a cost of sh.57,000 from Ken-suit wholesalers. Had he bought the same number of
suits from Umoja wholesalers it would have costed him sh.480 less per suit. This would have enabled him to buy 4
extra suits for the same amount of money.
a) Find the number of suits the tailor bought.
b) The tailor later sold each suit for sh.720 more than he had paid for it. Determine the percentage profit he made.
Date posted: May 6, 2019. Answers (1)
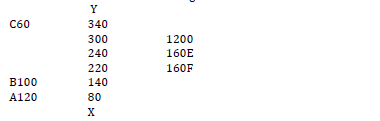
- The following measurement were recorded in a field book using XY as the baseline. XY = 400m.(Solved)
The following measurement were recorded in a field book using XY as the baseline. XY = 400m.
a) Using a scale of 1:4000 draw an accurate map of the farm.
b) Determine the actual area of the farm in hectares.
c) If the farm is on sale at sh.80,000 per hectare find how much the farm costs.
Date posted: May 6, 2019. Answers (1)
- A room is constructed such that its external length and breadth are 7.5m and 5.3m respectively. The thickness of the
wall is 15cm and its height...(Solved)
A room is constructed such that its external length and breadth are 7.5m and 5.3m respectively. The thickness of the
wall is 15cm and its height is 3.3 metres. A total space of 5m2 is left for doors and windows on the walls.
a) Calculate the volume of:
(i) the materials needed to construct the walls without the doors and windows.
(ii) the materials needed to construct the walls with doors and windows.
b) The blocks used in constructing the walls are 450mm by 200mm by 150mm. 0.225m3 of cement is used to join the
blocks. Calculate the number of blocks. Calculate the number of blocks needed to construct the room.
Date posted: May 3, 2019. Answers (1)
- From a reservoir, water flows through a cylindrical pipe of diameter 0.2m at a rate of 0.35m/s.(Solved)
From a reservoir, water flows through a cylindrical pipe of diameter 0.2m at a rate of 0.35m/s.
a) Determine the number of litres of water discharged from the reservoir in one hour.
b) The water flows from the reservoir for 18 hours per day for 25 days per month and serves a population of 2500
families. Determine the average consumption of water per family per month giving your answer to nearest 100 litres.
c) The water is charged at the rate of sh.450 per 100 litres. Calculate the average water bill per family per month.
Date posted: May 3, 2019. Answers (1)
- a)Given that y = 7 + 3x – x2, complete the table below(Solved)
a)Given that y = 7 + 3x – x2, complete the table below

b) On the grid provided and using a suitable scale draw the graph of y=7 + 3x – x2.
c) On the same grid draw a straight line using the graph to solve x2 – 4x -3 = 0
d) Determine the coordinates of the turning point of the curve.
Date posted: May 3, 2019. Answers (1)