Use this velocity - time graph which represents the motion of a car for 10 seconds, to find:(Solved)
Use this velocity - time graph which represents the motion of a car for 10 seconds, to find:
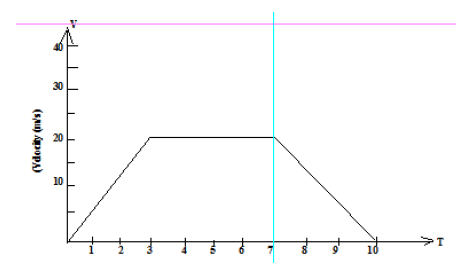
a) The rate of acceleration.
b) The rate of retardation.
c) The total distance travelled.
d) The total distance travelled during the first 4 seconds.
e) The average speed maintained during this journey.
f) The distance travelled at the constant speed.
Date posted: May 6, 2019. Answers (1)
A line T passes through points (-3, -5) and (3, -6) and is perpendicular to a line l at (-2, -2).(Solved)
A line T passes through points (-3, -5) and (3, -6) and is perpendicular to a line l at (-2, -2).
a) Find the equation of l.
b) Find the equation of T in the form ax + by = c where a, b and c are constants.
c) Given that another line Q is parallel to T and passes through (1, -3) find x and y intercepts of Q.
d) Find the points of intersection of L and Q.
Date posted: May 6, 2019. Answers (1)
Maina can do a piece of work in 12 hours. Muthui can do it in 20 hours. How long would it take Muthui to complete...(Solved)
Maina can do a piece of work in 12 hours. Muthui can do it in 20 hours. How long would it take Muthui to complete the work if Maina has been working for 7 hours.
Date posted: May 6, 2019. Answers (1)
A particle moving in a straight line has its displacement x metres from the origin O at time t seconds defined by the
equation x =...(Solved)
A particle moving in a straight line has its displacement x metres from the origin O at time t seconds defined by the
equation x = t3 - 6t2 + 7. Determine the values of t for which the particle is momentarily at rest.
Date posted: May 6, 2019. Answers (1)
A point A (-1, 3) is mapped onto A1(8, 12). Fidn the centre of enlargement given that the scale factor is 2.(Solved)
A point A (-1, 3) is mapped onto A1(8, 12). Fidn the centre of enlargement given that the scale factor is 2.
Date posted: May 6, 2019. Answers (1)
A major arc of a circle substends an angle of 2500 at the centre of a circle. If the radius of the circle is 9.8cm...(Solved)
A major arc of a circle substends an angle of 2500 at the centre of a circle. If the radius of the circle is 9.8cm find the area of the minor sector. (Use 𝜋 = 22/7)
Date posted: May 6, 2019. Answers (1)
Solve 15 < 5 (3 - x) = 30 hence show your solution on a number line.(Solved)
Solve 15 < 5 (3 - x) ≤ 30 hence show your solution on a number line.
Date posted: May 6, 2019. Answers (1)
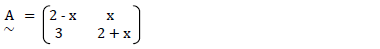
Find the values of x for which A has no inverse.(Solved)
Find the values of x for which A has no inverse.
Date posted: May 6, 2019. Answers (1)
Construct a DABC in which BC = 5cm, 0 and 0. From A drop a perpendicular to BC and measure its
length to the nearest mm.(Solved)
Construct a triangle ABC in which BC = 5cm, 0 and 0. From A drop a perpendicular to BC and measure its length to the nearest mm.
Date posted: May 6, 2019. Answers (1)