- A triangle has vertices A (1,2), B (7,2) and C (5,4)(Solved)
A triangle has vertices A (1,2), B (7,2) and C (5,4)
a) Draw ABC on the Cartesian plane.
b) Construct the image triangle 𝐴1𝐵1𝐶1 of triangle ABC under negative quarter turn about the origin.
c) Draw triangle 𝐴11𝐵11𝐶11 the image of triangle 𝐴1𝐵1𝐶1 under reflection in the line y=x. State the coordinates
of 𝐴11𝐵11𝐶11.
d) Find a single matrix of transformation which maps triangle ABC on to triangle𝐴11𝐵11𝐶11
e) Describe a single transformation that maps triangle 𝐴11𝐵11𝐶11 on triangle ABC.
Date posted: May 7, 2019. Answers (1)
- The probability that three dart players Akinyi, kamau and Juma hit bull’s eye are 0.2, 0.3 and 0.15 respectively.(Solved)
The probability that three dart players Akinyi, kamau and Juma hit bull’s eye are 0.2, 0.3 and 0.15 respectively.
a) If each plays once show the possible outcomes on a tree diagram.
b) Calculate the probability that
i)All hit the bulls eye
ii)Only one hit the bulls eye
iii)Almost one misses the bulls eye.
Date posted: May 7, 2019. Answers (1)
- a) Using mid-ordinate rule, estimate the area under the curve y =1/2x2 - 2. Using six strips between x=2 and x=8and x-axis.(Solved)
a) Using mid-ordinate rule, estimate the area under the curve y =1/2x2 - 2. Using six strips between x=2 and x=8
and x-axis.
b) Using intergration to determine the exact area under the curve.
c) Find the percentage error in calculating the area using the mid-ordinate rule.
Date posted: May 7, 2019. Answers (1)
- In the figure below A and B are centres of circles. PQ=12cm is an internal tangent AB=15cm and the ratio of the radii
is 2:3(Solved)
In the figure below A and B are centres of circles. PQ=12cm is an internal tangent AB=15cm and the ratio of the radii
is 2:3
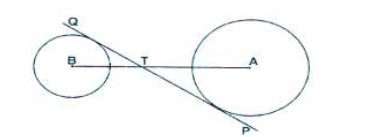
Calculate :
a) The radii of the circles
b) Distance AT and TQ
Date posted: May 7, 2019. Answers (1)
- The table shows income tax rates.(Solved)
The table shows income tax rates.
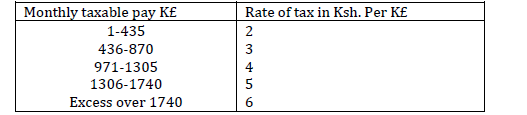
A company employee earn a monthly basic salary of Ksh. 30,000 and is also given taxable allowances amounting to
Ksh. 10480.
a) Calculate the total income tax.
b) The employee is entitled to a personal tax relief of Ksh. 800 per month. Determine the net tax.
c) If the employee received a 50% increase in his total income. Calculate the corresponding percentage increase on the
income tax.
Date posted: May 7, 2019. Answers (1)
- Obtain the integral values of x for which 3 < 27x< 81(Solved)
Obtain the integral values of x for which 3 < 27x< 81
Date posted: May 7, 2019. Answers (1)
- The length and width of a rectangle are 8.3cm and 4.2cm respectively correct to the nearest millimeter. Calculate the
percentage error in the area of the...(Solved)
The length and width of a rectangle are 8.3cm and 4.2cm respectively correct to the nearest millimeter. Calculate the
percentage error in the area of the rectangle.
Date posted: May 7, 2019. Answers (1)
- Find the equation of the normal to the curve. y = x2 + 4x - 3 at point (1,3)(Solved)
Find the equation of the normal to the curve.
y = x2 + 4x - 3 at point (1,3)
Date posted: May 7, 2019. Answers (1)
- A quantity y varies partly as x2 and partly as x. When y=6, x=1 and when y=30, x=3.Find y when x=3.(Solved)
A quantity y varies partly as x2 and partly as x. When y=6, x=1 and when y=30, x=3.Find y when x=3.
Date posted: May 7, 2019. Answers (1)
- Point P(400S, 450E) and point Q (400S, 600W) are on the surface of the earth. Calculate the shortest distance along a circle of latitude between...(Solved)
Point 𝑃(400𝑆, 450E) and point Q (400𝑆, 600𝑊) are on the surface of the earth. Calculate the shortest distance along a circle of latitude between the two points.
Date posted: May 7, 2019. Answers (1)
- The cost of the 2 brands of coffee A and B per kg are sh. 59.40 and sh. 72 respectively. The two brands are mixed...(Solved)
The cost of the 2 brands of coffee A and B per kg are sh. 59.40 and sh. 72 respectively. The two brands are mixed in the
ratio x: y and sold at a profit of 20 % above the cost. If the selling price per kg of mixture is sh. 72. Find the value of x
and y.
Date posted: May 7, 2019. Answers (1)
- The 3rd term of a geometric sequence is 20 and the 6th term is -160. Calculate the 8th term.(Solved)
The 3rd term of a geometric sequence is 20 and the 6th term is -160. Calculate the 8th term.
Date posted: May 7, 2019. Answers (1)
- Solve 4 - 4 Cos2 x = 4 sin x - 1 for....(Solved)
Solve 4 - 4 Cos2 x = 4 sin ?? - 1 for 00 <_ x <_ 3600
Date posted: May 7, 2019. Answers (1)
- Simplify the following(Solved)
Simplify the following

Date posted: May 7, 2019. Answers (1)
- A cold water tap can fill a bath in 10 minutes while a hot water tap can fill it in 8 minutes. The drainage pipe...(Solved)
A cold water tap can fill a bath in 10 minutes while a hot water tap can fill it in 8 minutes. The drainage pipe can empty
the bath in 5 minutes. The cold water and hot water taps are opened for 4 minutes all the 3 taps are opened. Find how
long it will take to fill the bath.
Date posted: May 7, 2019. Answers (1)
- Object A of area 10 cm2 is mapped on to its image B of area 60 cm2 by transformation whose matrix is given below. Find the positive values...(Solved)
Object A of area 10 cm2 is mapped on to its image B of area 60 cm2 by transformation whose matrix is given below.Find the positive values of x

Date posted: May 7, 2019. Answers (1)
- Find the binomial expansion of the following expression upto the term in ??3. Hence estimate the value of
(1.04)7 correct to 4d.p.(Solved)
Find the binomial expansion of the following expression upto the term in 𝑥3. Hence estimate the value of
(1.04)7 correct to 4d.p.

Date posted: May 7, 2019. Answers (1)
- Draw the locus of the points that satisfy inequalities (y - 3)2 + (x - 2)2 <_ 9 and x + y >_ 6(Solved)
Draw the locus of the points that satisfy inequalities (y - 3)2 + (x - 2)2 <_ 9 and x + y >_ 6
Date posted: May 7, 2019. Answers (1)
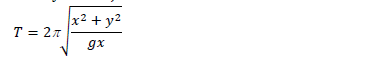
- Make y the subject of the formula.(Solved)
Make y the subject of the formula.
Date posted: May 7, 2019. Answers (1)
- Find the value of X(Solved)
Find the value of X
(5𝑥)5𝑥-1 = 10
Date posted: May 7, 2019. Answers (1)