- A water tank has a capacity of 70 litres. A similar model tank has a capacity of 0.25 litres. If the larger tank has a...(Solved)
A water tank has a capacity of 70 litres. A similar model tank has a capacity of 0.25 litres. If the larger tank has a height
of 150cm, calculate the height of the model.
Date posted: May 10, 2019. Answers (1)
- Simplify the expressions;(Solved)
Simplify the expressions;
Date posted: May 10, 2019. Answers (1)
- Use tables of squares, square roots and reciprocals to evaluate to 3 decimal places.(Solved)
Use tables of squares, square roots and reciprocals to evaluate to 3 decimal places.

Date posted: May 10, 2019. Answers (1)
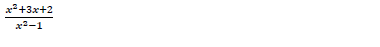
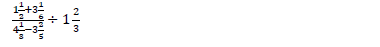
- Simplify the expression(Solved)
Simplify the expression
Date posted: May 10, 2019. Answers (1)
- In chemistry form 4 classes, 1/3 of the class are girls and the rest boys, 4/5 of the boys and 9/10 of the girls are...(Solved)
In chemistry form 4 classes, 1/3 of the class are girls and the rest boys, 4/5 of the boys and 9/10 of the girls are right handed
while the rest are left handed. The probability that a right-handed student breaks a conical flask in any practical session is
3/10 and the corresponding probability of a left-handed student 4/10 . The probabilities are independent of the students
gender.
a) Represent the above information on a tree diagram with independent probabilities.
b) Determine the probability that student chosen at random form the class is left handed and does not break a conical flask in
simplest form.
c) Determine the probability that a conical flask is broken in any chemistry practical session in simplest
d) Determine the probability that a conical flask is not broken by a right-handed student in the simplest form.
Date posted: May 9, 2019. Answers (1)
- The velocity , Vm/s, of the particles projected into space is given by the formula: V = 5t² - 2t² + 9 where t is...(Solved)
The velocity , Vm/s, of the particles projected into space is given by the formula: V = 5t² - 2t² + 9 where t is time in seconds
elapsed since projection,
Determine
a) The acceleration of the particle when t = 4
b) The value of t which minimises the acceleration.
c) The velocity of the particle when acceleration is minimum
d) The total distance moved by the particle between t = 1 to t = 4 seconds.
Date posted: May 9, 2019. Answers (1)
- Use a ruler and a pair of compass only in the constructions below:(Solved)
Use a ruler and a pair of compass only in the constructions below:
a) Construct a triangle ABC such that AB = 4cm, BC = 5cm and angle ABC = 120°, measure AC.
b) On the same diagram
i) locate P the locus of a point equidistance from the three vertices of the triangle ABC and demonstrate this using a circle.
Measure the radius of the circle.
ii) On the same side of BC as A, construct Q the locus of points such that angle BQC = 120°.
iii) On the side of AC opposite point B construct R the locus of points 4cm from line AC.
iv) Within the circle shade the set of points such that Angle BQC ≥ 120°
Date posted: May 9, 2019. Answers (1)
- A plane took 2h 10 minutes to fly from town A(6°S, 70°E) to town B (18°N, 70°E) (Take the radius of the earth to be...(Solved)
A plane took 2h 10 minutes to fly from town A(6°S, 70°E) to town B (18°N, 70°E) (Take the radius of the earth to be 6370km
and PI = 22/7 )
a) Find the average speed of the plane.
b) A traveller in the plane spent 30 minutes in town B conducting some business. He took a second plane to town C (18°N,
10°E). The average speed of the second plane was 70% that o the first plane. Determine the time to the nearest minute the
plane took to travel from B to C.
c) When the plane took off at town A the local time was 0400h. Find the local time at C when the traveller arrived .
Date posted: May 9, 2019. Answers (1)
- In the figure below EFGHIJKL is a square based frustum whose dimensions are as shown. The perpendicular height of the
frustum is 9cm. Given that EF...(Solved)
In the figure below EFGHIJKL is a square based frustum whose dimensions are as shown. The perpendicular height of the
frustum is 9cm. Given that EF = FG = GH = HE = 10cm and JK=KL=IL=IJ=4cm.
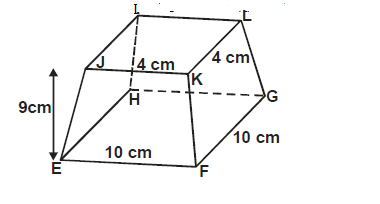
a) Calculate
i) The altitude of the pyramid
ii) The angle between the line FK and the base EFGH
iii) The angle between line LG and EF
b) The volume of the frustum
Date posted: May 9, 2019. Answers (1)
- Each acre of potatoes required 9 men and each acre of cabbages requires 2 men. The farmer has 240 men available and he
must plant at...(Solved)
Each acre of potatoes required 9 men and each acre of cabbages requires 2 men. The farmer has 240 men available and he
must plant at least 10 acres of potatoes. The profit on potatoes is Kshs 1000 per acre and on cabbages is Kshs 1200 per
acre. If he plants x acres of potatoes and y acres of cabbages:
a) Write down three inequalities in x and y to describe this information
b) Represent these inequalities graphically.
c) Use your graph to determine the number of acres for each crop which will give maximum profit and hence find the
maximum profit.
Date posted: May 9, 2019. Answers (1)
- In the figure below ABC is a tangent to the circle centre O. DOG is a diameter, angle DGF = 60°. angle DBC = 48°...(Solved)
In the figure below ABC is a tangent to the circle centre O. DOG is a diameter, angle DGF = 60°. angle DBC = 48° and angle
DFE = 25°. Giving reasons, find the size of angles:
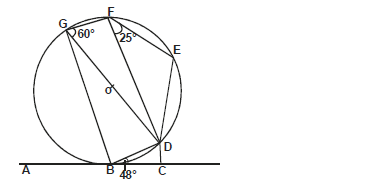
i) Angle FEB
ii) Obtuse FOB
iii) Angle EBD
iv) Angle BCD
v) Angle OBE
Date posted: May 9, 2019. Answers (1)
- a) Find the inverse of the matrix.(Solved)
a) Find the inverse of the matrix.
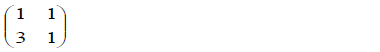
b) Hence determine the point of intersection of the lines.
y + x = 7
3x + y = 15
Date posted: May 9, 2019. Answers (1)
- After how many years would Kshs 15,000 amount to Kshs 24,015.50 at a rate of 16% p.a. compounded quarterly?(Solved)
After how many years would Kshs 15,000 amount to Kshs 24,015.50 at a rate of 16% p.a. compounded quarterly?
Date posted: May 9, 2019. Answers (1)
- Given that the dimensions of a rectangle are 12.0cm and 25.0cm. Find the percentage error in calculating the area.(Solved)
Given that the dimensions of a rectangle are 12.0cm and 25.0cm. Find the percentage error in calculating the area.
Date posted: May 9, 2019. Answers (1)
- T is a transformation represented by the matrix below;(Solved)
T is a transformation represented by the matrix below;
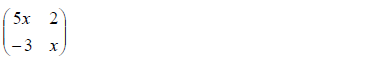
Under T, a square of area of 18cm² is mapped into a square of area 110cm². Find the value of x.
Date posted: May 9, 2019. Answers (1)
- In the figure below QT is a tangent to a circle at Q. PXRT and QXS are straight lines. PX =6cm, RT=8cm, QX=4.8cm and XS...(Solved)
In the figure below QT is a tangent to a circle at Q. PXRT and QXS are straight lines. PX =6cm, RT=8cm, QX=4.8cm and XS =
5cm.
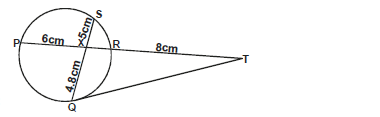
Find the length of :
a) XR
b) QT
Date posted: May 9, 2019. Answers (1)
- Two types of tea which cost Kshs 200 per kg and Kshs 250 per kg are mixed so that their weights are in the ratio...(Solved)
Two types of tea which cost Kshs 200 per kg and Kshs 250 per kg are mixed so that their weights are in the ratio 5 : 3
respectively. Calculate the cost of 20kg of the mixture.
Date posted: May 9, 2019. Answers (1)
- Find the centre of radius of a circle whose equation is 3x² + 3y² - 18x + 12y + 39 = 12(Solved)
Find the centre of radius of a circle whose equation is 3x² + 3y² - 18x + 12y + 39 = 12
Date posted: May 9, 2019. Answers (1)
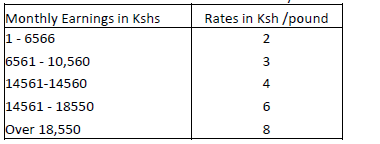
- Mr. Partel a civil servant pays PAYE of Kshs 3500 per month. He is entitled to a personal relief of Kshs 1164 per month. Using
the...(Solved)
Mr. Partel a civil servant pays PAYE of Kshs 3500 per month. He is entitled to a personal relief of Kshs 1164 per month. Using
the tax brackets below. Find Partel's monthly taxable income.
Date posted: May 9, 2019. Answers (1)
- Solve the trigonometric equation for 0°= x =360°.
3Cos²x + 8 Sin x - 4 = 3(Solved)
Solve the trigonometric equation for 0°≤ x ≤360°.
3Cos²x + 8 Sin x - 4 = 3
Date posted: May 9, 2019. Answers (1)