-
The diagram below represents a food web in a certain ecosystem.
a) Name the trophic level occupied by each of the following:
i) Caterpillar .
ii) Small...
(Solved)
The diagram below represents a food web in a certain ecosystem.

a) Name the trophic level occupied by each of the following:
i) Caterpillar .
ii) Small insects .
b) From the food web, construct two food chains which end with lizards as tertiary consumer.
c) i) Which organisms have the least biomass in this ecosystem?
ii) Explain the answer in c(i) above.
Date posted:
May 24, 2019
.
Answers (1)
-
State the structural modification of nephron in the desert mammals.
(Solved)
State the structural modification of nephron in the desert mammals.
Date posted:
May 24, 2019
.
Answers (1)
-
An experiment was carried out to find out the concentrations of ions in the cell sap of an aquatic plant and that of the water...
(Solved)
An experiment was carried out to find out the concentrations of ions in the cell sap of an aquatic plant and that of the water in the pond in which they grew.
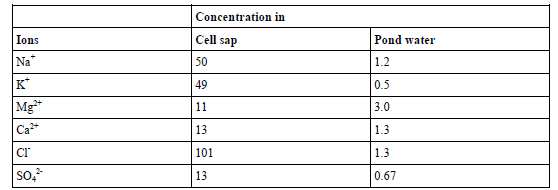
a) i) Name the process by which the aquatic plant absorbs ions from the pond water.
ii) Outline four roles of the process you have named in (a) (i) above in a mammalian body.
b) How can the rate of uptake of ions by aquatic plants be increased.
c) Name the part of the cell that allows passage of ions in and out of the cell.
Date posted:
May 24, 2019
.
Answers (1)
-
When pure breeding red flowered plants were crossed with pure breeding white flowered plant, the offspring were all pink
flowered.
a) Using letter R to represent the...
(Solved)
When pure breeding red flowered plants were crossed with pure breeding white flowered plant, the offspring were all pink
flowered.
a) Using letter R to represent the gene for red coloured flower plants and W for the gene for the white flowered plants.
Workout the genotypic ratio of F2 generation.
b) State the phenotypic ratio of F2 generation.
c) i) What is the name given to a condition when two alleles in heterozygon state contribute equally to the phenotype of an
organizations.
ii) Give an example of a trait in human beings where the above condition in c(i) above express itself.
Date posted:
May 24, 2019
.
Answers (1)
-
How is a sugarcane flower adapted to wind pollination?
(Solved)
How is a sugarcane flower adapted to wind pollination?
Date posted:
May 24, 2019
.
Answers (1)
-
Differentiate between photosynthesis and respiration.
(Solved)
Differentiate between photosynthesis and respiration.
Date posted:
May 24, 2019
.
Answers (1)
-
In an experiment, a black mouse was mated with a brown mouse. All the offsprings in F1 generated were black. The offspring grew and were...
(Solved)
In an experiment, a black mouse was mated with a brown mouse. All the offsprings in F1 generated were black. The offspring grew and were all allowed to mate with one another. The total number of F2 generation offspring were 96.
(a) Using letter B to denote the gene for black colour, work out the genotype of the F1 generation.(Use a punnet square)
(b) State the following for the F2 generation.
(i) Genotypic ratio.
(ii) Phenotypic ratio
(iii) The total number of brown mice.
Date posted:
May 24, 2019
.
Answers (1)
-
The following diagram is a longitudinal section of the root apex.
Identify the parts labeled A, B and C.
(Solved)
The following diagram is a longitudinal section of the root apex.
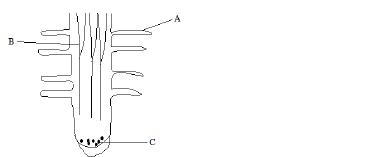
Identify the parts labeled A, B and C.
Date posted:
May 24, 2019
.
Answers (1)
-
The graph below represents the growth in a certain phylum.
(a) Name the type of growth pattern shown on the graph.
(b) Identify the process represented...
(Solved)
The graph below represents the growth in a certain phylum.
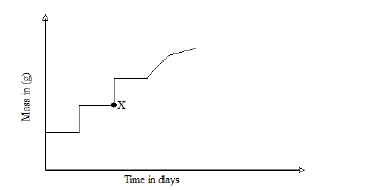
(a) Name the type of growth pattern shown on the graph.
(b) Identify the process represented by X.
(c) Name the hormone responsible for the process in (b) above.
Date posted:
May 24, 2019
.
Answers (1)
-
What characteristics do mammalian lungs and the gills of bony fish have in common that enables them to exchange gases efficiently?
(Solved)
What characteristics do mammalian lungs and the gills of bony fish have in common that enables them to exchange gases efficiently?
Date posted:
May 24, 2019
.
Answers (1)
-
State two adaptation of herbivorous which enable them to digest cellulose?
(Solved)
State two adaptation of herbivorous which enable them to digest cellulose?
Date posted:
May 24, 2019
.
Answers (1)
-
With a reason, name the organelles that would be found in large numbers in cell of secretory glands.
(Solved)
With a reason, name the organelles that would be found in large numbers in cell of secretory glands.
Date posted:
May 24, 2019
.
Answers (1)
-
State three sites of gaseous exchange in mesophytes.
(Solved)
State three sites of gaseous exchange in mesophytes.
Date posted:
May 24, 2019
.
Answers (1)
-
The diagram below shows an experiment on germination peas.
a) (i) What changes are observable at the end of the experiment?
(ii) Give the reason the...
(Solved)
The diagram below shows an experiment on germination peas.
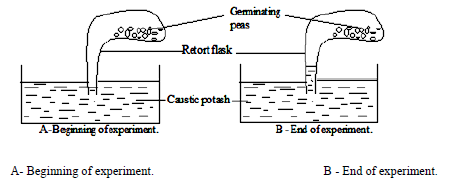
a) (i) What changes are observable at the end of the experiment?
(ii) Give the reason the observation in a(i) above.
(b) If water had been used instead of caustic potash in the experiments, what would be observed?
Date posted:
May 24, 2019
.
Answers (1)
-
Describe the way by which terrestrial plants are adapted to living in arid and semi-arid ecosystems.
(Solved)
Describe the way by which terrestrial plants are adapted to living in arid and semi-arid ecosystems.
Date posted:
May 24, 2019
.
Answers (1)
-
Describe the adaptations of wind pollinated flowers.
(Solved)
Describe the adaptations of wind pollinated flowers.
Date posted:
May 24, 2019
.
Answers (1)
-
The diagram below represent a seedling.
a) Name the structure labelled B
b) State the functions of the parts labelled A and C
c) Name the...
(Solved)
The diagram below represent a seedling.
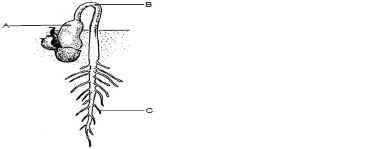
a) Name the structure labelled B
b) State the functions of the parts labelled A and C
c) Name the type of germination exhibited by the seedling.
d) State three conditions within the seed necessary for germination.
e) What is the importance of optimum temperature in seed germination ?
Date posted:
May 24, 2019
.
Answers (1)
-
The diagram below represents a transverse section of a young stem.
a) Name the parts labelled A and C on the diagram.
b) State the functions...
(Solved)
The diagram below represents a transverse section of a young stem.

a) Name the parts labelled A and C on the diagram.
b) State the functions of the parts labelled B, D and E
c) List three differences between the section shown above and one that would be obtained from the
root of the same plant.
Date posted:
May 24, 2019
.
Answers (1)
-
The diagram below is a cross section through a part of human ileum.
a) i) Identify the structure drawn above.
ii) State the significance of the...
(Solved)
The diagram below is a cross section through a part of human ileum.
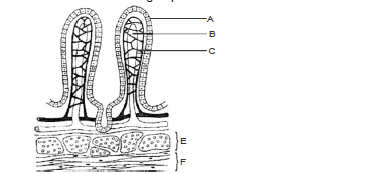
a) i) Identify the structure drawn above.
ii) State the significance of the structure shown above.
b) Name the parts labelled A, B and C
c) Give the functions of the part labelled B and C.
Date posted:
May 24, 2019
.
Answers (1)
-
The diagram below represents phloem tissue from the stem of a plant.
i) Name the structure labelled A.
ii) State TWO substances transported in the phloem....
(Solved)
The diagram below represents phloem tissue from the stem of a plant.
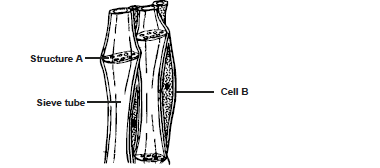
i) Name the structure labelled A.
ii) State TWO substances transported in the phloem.
iii) Give the function of cell B.
Date posted:
May 24, 2019
.
Answers (1)