Graph A represent spring with smaller diameter and graph B is spring of the larger diameter the smaller the spring constant due to force acting on a large area hence less stiff
Kavungya answered the question on May 25, 2019 at 08:37
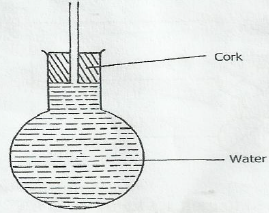
- When the flask is placed in iced water the level on water rose and then fell. Explain this observation.(Solved)
When the flask is placed in iced water the level on water rose and then fell. Explain this observation.
Date posted: May 25, 2019. Answers (1)
- A 20kw immersion water heater is used to heat 5.0 x 10⁻³m3 of water from 23oC to 100oC. Given that 30% of heat is lost...(Solved)
A 20kw immersion water heater is used to heat 5.0 x 10⁻³m3 of water from 23oC to 100oC. Given that 30% of heat is lost to the surroundings, determine the time used in heating the water.
Date posted: May 25, 2019. Answers (1)
- An aircraft 300m from the ground traveling horizontally at 400m/s releases a parcel. Calculate the horizontal distance covered by the parcel from the point of...(Solved)
An aircraft 300m from the ground traveling horizontally at 400m/s releases a parcel. Calculate the horizontal distance covered by the parcel from the point of release.(Ignore air resistance).
Date posted: May 25, 2019. Answers (1)
- In an experiment a crystal of potassium permanganate was placed in water as shown below.
After sometime, it was observed that the water turned purple. Explain...(Solved)
In an experiment a crystal of potassium permanganate was placed in water as shown below.
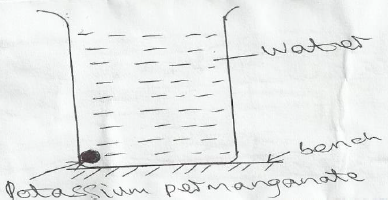
After sometime, it was observed that the water turned purple. Explain this observation.
Date posted: May 25, 2019. Answers (1)
- The figure below shows a capillary tube placed in a trough of mercury.
Give a reason why the level of mercury in a capillary is lower...(Solved)
The figure below shows a capillary tube placed in a trough of mercury.
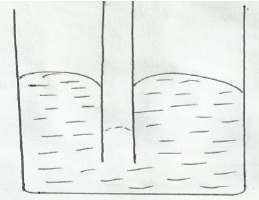
Give a reason why the level of mercury in a capillary is lower than in the beaker.
Date posted: May 25, 2019. Answers (1)
- The figure below shows a pith ball in a container.
State and explain what would happen if air is blown over the mouth of the...(Solved)
The figure below shows a pith ball in a container.
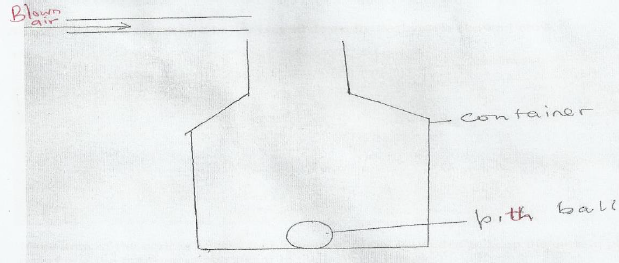
State and explain what would happen if air is blown over the mouth of the container.
Date posted: May 25, 2019. Answers (1)
- Sketch a velocity – time graph for a body initially moving at a velocity u before a force F is applied to it for 5...(Solved)
Sketch a velocity – time graph for a body initially moving at a velocity u before a force F is applied to it for 5 seconds and there after the force F is withdrawn.
Date posted: May 25, 2019. Answers (1)
- A turntable of radius 16cm is rotating at 960 revolutions per minute. Determine the angular speed of the turntable.(Solved)
A turntable of radius 16cm is rotating at 960 revolutions per minute. Determine the angular speed of the turntable.
Date posted: May 25, 2019. Answers (1)
- A bus that carries goods in the under seats carrier is more stable than one that carries goods in the carrier at the top. Explain...(Solved)
A bus that carries goods in the under seats carrier is more stable than one that carries goods in the carrier at the top. Explain why this is so.
Date posted: May 25, 2019. Answers (1)
- The figure below shows two identical containers A and B containing hot water and ice block.
State with reason which water cools faster assuming that the...(Solved)
The figure below shows two identical containers A and B containing hot water and ice block.
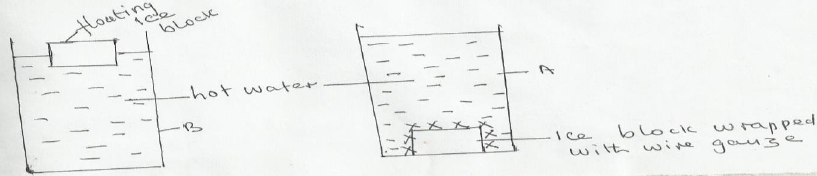
State with reason which water cools faster assuming that the wire gauge absorbs negligible heat.
Date posted: May 25, 2019. Answers (1)
- The diagram below shows a section of a micrometer screw gauge.
a) State the smallest measurement that can be made by the measurement that can be...(Solved)
The diagram below shows a section of a micrometer screw gauge.
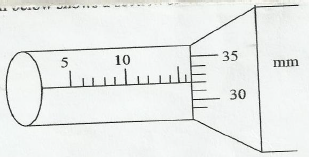
a) State the smallest measurement that can be made by the measurement that can be made by the micrometer screw gauge.
b) The thimble of the micrometer screw gauge is rotated through 2 ½ revolutions in the clockwise direction in order to
measure the diameter of a marble. State the diameter of the marble.
Date posted: May 25, 2019. Answers (1)
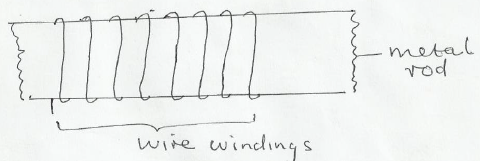
- The figure below shows a wire wound on a metal rod. The windings just touch each other. If the total number of complete loops was...(Solved)
The figure below shows a wire wound on a metal rod. The windings just touch each other. If the total number of complete loops was found to be 25 and the distance covered by the windings on the rod is 0.6cm, find the radius of the wire giving your answer in standard form.
Date posted: May 25, 2019. Answers (1)
- Calculate the critical angle of a ray of light passing from glass to water, if their refractive indices are 2/3 and 4/3 respectively.(Solved)
Calculate the critical angle of a ray of light passing from glass to water, if their refractive indices are 2/3 and 4/3 respectively.
Date posted: May 25, 2019. Answers (1)
- Explain why large convex mirrors are placed at certain points in supermarket(Solved)
Explain why large convex mirrors are placed at certain points in supermarket
Date posted: May 25, 2019. Answers (1)
- An object 2.5 m tall is at a point 8m from a pinhole camera. If the distance of the screen is 8.16m from the object,...(Solved)
An object 2.5 m tall is at a point 8m from a pinhole camera. If the distance of the screen is 8.16m from the object, calculate the size of the image
Date posted: May 25, 2019. Answers (1)
- The figure below shows a G.M tube.
i) What is the purpose of the mica window?
ii) What is the purpose of the bromine
iii) Briefly explain...(Solved)
The figure below shows a G.M tube.
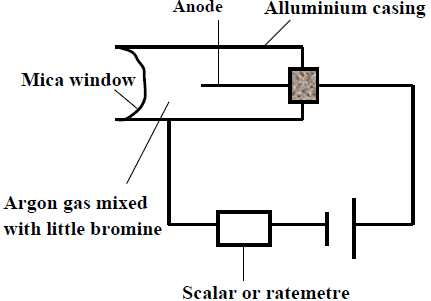
i) What is the purpose of the mica window?
ii) What is the purpose of the bromine
iii) Briefly explain how it works.
Date posted: May 25, 2019. Answers (1)
- The figure below shows a simple generator and the arrows indicate the direction of induced current.
(i) What type of generator is shown above ?
(ii)...(Solved)
The figure below shows a simple generator and the arrows indicate the direction of induced current.
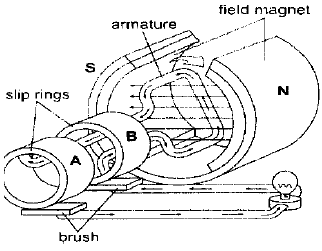
(i) What type of generator is shown above ?
(ii) State two ways of increasing the brightness of the bulb.
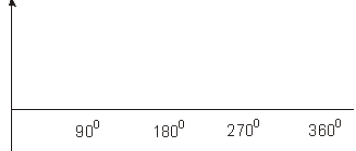
(iii) If the bulb was replaced by a CRO sketch on the axes provided a graph to show the variation of output emf with position of the coil starting from vertical position.
Date posted: May 25, 2019. Answers (1)
- The figure below shows a domestic wiring system.
(i) Point out two faults in the circuit.
(ii) What is the fuse made of and why is...(Solved)
The figure below shows a domestic wiring system.
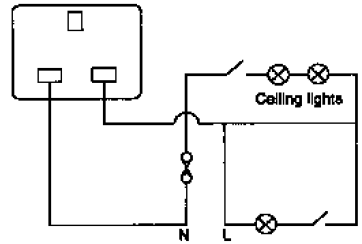
(i) Point out two faults in the circuit.
(ii) What is the fuse made of and why is it necessary in the circuit?
Date posted: May 25, 2019. Answers (1)
- A transformer has 800 turns in the primary windings. The alternating e.m.f connected to the primary
is 240V and the current flowing is 0.2A. Find the...(Solved)
A transformer has 800 turns in the primary windings. The alternating e.m.f connected to the primary
is 240V and the current flowing is 0.2A. Find the power in the secondary coil if the transformer is 90% efficient
Date posted: May 25, 2019. Answers (1)
- The figure below shows a bridge rectifier.
i) Define the term rectification.
ii) Describe how the illustrated rectifier works.
iii) State the modification that can...(Solved)
The figure below shows a bridge rectifier.
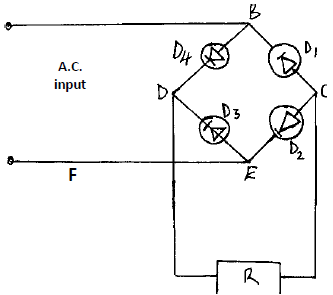
i) Define the term rectification.
ii) Describe how the illustrated rectifier works.
iii) State the modification that can be made on the arrangement to improve the quality of the output.
Date posted: May 25, 2019. Answers (1)