- Give three benefits of eco-tourism.(Solved)
Give three benefits of eco-tourism.
Date posted: May 27, 2019. Answers (1)
- Define
i) Divide
ii) Confluence(Solved)
Define
i) Divide
ii) Confluence
Date posted: May 27, 2019. Answers (1)
- Name three zones of mid-latitude grasslands.(Solved)
Name three zones of mid-latitude grasslands.
Date posted: May 27, 2019. Answers (1)
- Name three areas experiencing micro-climates(Solved)
Name three areas experiencing micro-climates
Date posted: May 27, 2019. Answers (1)
- You are planning to carry out a field study in a limestone area.
i) Formulate two hypotheses for the study.
ii) Name three surface features you are...(Solved)
You are planning to carry out a field study in a limestone area.
i) Formulate two hypotheses for the study.
ii) Name three surface features you are likely to identify.
iii) State two problems you may encounter while in the field.
Date posted: May 27, 2019. Answers (1)
- Study the diagram below and answer the questions that follow.
Name the parts marked A and B(Solved)
Study the diagram below and answer the questions that follow.
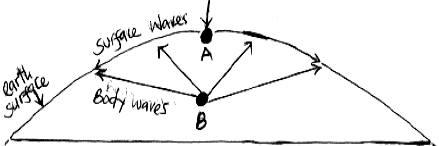
Name the parts marked A and B
Date posted: May 27, 2019. Answers (1)
- State the importances of having route maps.(Solved)
State the importances of having route maps.
Date posted: May 27, 2019. Answers (1)
- Give three main types of regions where earthquakes occur.(Solved)
Give three main types of regions where earthquakes occur.
Date posted: May 27, 2019. Answers (1)
- Name the countries where the following fold mountains are found.
i) A kwapim hills
ii) Deccan Plateau
iii) Cape ranges(Solved)
Name the countries where the following fold mountains are found.
i) A kwapim hills
ii) Deccan Plateau
iii) Cape ranges
Date posted: May 27, 2019. Answers (1)
- Distinguish between orogeny and orogenesis.(Solved)
Distinguish between orogeny and orogenesis.
Date posted: May 27, 2019. Answers (1)
- A mass of air at 30oc can hold 17.117gm/m3 of moisture. The same air at the same temperature has 8.262gm/m3 of moisture. Calculate its relative...(Solved)
A mass of air at 30oc can hold 17.117gm/m3 of moisture. The same air at the same temperature has 8.262gm/m3 of moisture. Calculate its relative humidity.
Date posted: May 27, 2019. Answers (1)
- State three factors that influence the salinity of water in oceans.(Solved)
State three factors that influence the salinity of water in oceans.
Date posted: May 27, 2019. Answers (1)
- Give an example of the lakes produced by wind erosion in Africa.(Solved)
Give an example of the lakes produced by wind erosion in Africa.
Date posted: May 27, 2019. Answers (1)
- State four reasons why the St. Lawrence Seaway project was set up.(Solved)
State four reasons why the St. Lawrence Seaway project was set up.
Date posted: May 27, 2019. Answers (1)
- You intended to carry out a field study on how trade is conducted in the local open air market.
(i) Give three advantages of studying trade...(Solved)
You intended to carry out a field study on how trade is conducted in the local open air market.
(i) Give three advantages of studying trade through field work.
(ii) State two methods the class may use to present their data.
Date posted: May 27, 2019. Answers (1)
- The diagram below shows the occurrence of petroleum in the earth’s crust.
(i) Name the substances in the areas labelled L, M and N.
(ii) Give two...(Solved)
The diagram below shows the occurrence of petroleum in the earth’s crust.
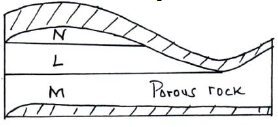
(i) Name the substances in the areas labelled L, M and N.
(ii) Give two by-products obtained when refining crude oil.
Date posted: May 27, 2019. Answers (1)
- Explain how the following factors influence horticultural farming in the Netherlands.
(a) Technology.
(b) Marketing systems.
(Solved)
Explain how the following factors influence horticultural farming in the Netherlands.
(a) Technology.
(b) Marketing systems.
Date posted: May 27, 2019. Answers (1)
- The table below shows the total number of horticultural crops exported from Kenya in 2008 and 2009. Use it to answer question a(i) and a(ii)...(Solved)
The table below shows the total number of horticultural crops exported from Kenya in 2008 and 2009. Use it to answer question a(i) and a(ii) below.

(i) Identify the crop which had the highest increase in the number of export in Kenya between 2008 and
2009 and indicate the change.
(ii) Calculate the percentage increase of onions between 2008 and 2009.
(iii) Draw a divided rectangle 15cm long and 5cm wide to represent the horticultural export from Kenya in 2009. Show your calculations.
Date posted: May 27, 2019. Answers (1)
- You are supposed to carry out a field study of an area eroded by water.
(i) Give four reasons why you need a map of the...(Solved)
You are supposed to carry out a field study of an area eroded by water.
(i) Give four reasons why you need a map of the area of study.
(ii) Name two erosional features you are likely to identify during the field study.
(iii) State three recommendations that you would make from your study to assist the local community to
rehabilitate the eroded area.
(iv) Give three reasons why you would need to prepare a working schedule.
Date posted: May 27, 2019. Answers (1)
- Name two types of ice masses found on mountains in East Africa.(Solved)
Name two types of ice masses found on mountains in East Africa.
Date posted: May 27, 2019. Answers (1)