(i) Increase in temperature increases the rate of enzyme reaction; because increase in temperature increases kinetic energy
causing substrate-enzyme collision
(ii) The rate of reaction is at maximum/best; because enzymes are working at their optimum temperature
(iii) The rate of reaction decreases with increase in temperature; because increase in temperature above optimum denatures
the enzymes.
(iv) PH; substrate concentration; enzyme inhibitors; co-factors and co-enzymes.
sharon kalunda answered the question on May 28, 2019 at 06:38
-
What would happen if a person secreted less antidiuretic hormone into the blood circulation?
(Solved)
What would happen if a person secreted less antidiuretic hormone into the blood circulation?
Date posted:
May 28, 2019
.
Answers (1)
-
State the inactive form of the enzyme trypsin.
(Solved)
State the inactive form of the enzyme trypsin.
Date posted:
May 28, 2019
.
Answers (1)
-
Explain why trypsin is secreted in inactive form
(Solved)
Explain why trypsin is secreted in inactive form
Date posted:
May 28, 2019
.
Answers (1)
-
Name the two hormones that prepares a person for emergency
(Solved)
Name the two hormones that prepares a person for emergency
Date posted:
May 28, 2019
.
Answers (1)
-
Give a reason for the presence of white matter in the central nervous system
(Solved)
Give a reason for the presence of white matter in the central nervous system
Date posted:
May 28, 2019
.
Answers (1)
-
State the components of peripheral nervous system
(Solved)
State the components of peripheral nervous system
Date posted:
May 28, 2019
.
Answers (1)
-
Chloroplasts in a palisade cell move away from extreme light intensity. Name the type of response by the chloroplast.
(Solved)
Chloroplasts in a palisade cell move away from extreme light intensity. Name the type of response by the chloroplast.
Date posted:
May 28, 2019
.
Answers (1)
-
Which plant growth hormone induces parthenocapy?
(Solved)
Which plant growth hormone induces parthenocapy?
Date posted:
May 28, 2019
.
Answers (1)
-
A student in form 3 caught an organism which had the following characteristics.
(i) Body divided into two parts
(ii) Simple eyes
(iii) Eight legs
Classify the organism up...
(Solved)
A student in form 3 caught an organism which had the following characteristics.
(i) Body divided into two parts
(ii) Simple eyes
(iii) Eight legs
Classify the organism up to the class level
Date posted:
May 28, 2019
.
Answers (1)
-
Explain each of the following:
(a) A mature plant cell does not lose its shape even after losing water
(b) Xylem vessels do not collapse even when...
(Solved)
Explain each of the following:
(a) A mature plant cell does not lose its shape even after losing water
(b) Xylem vessels do not collapse even when they are not conducting water
Date posted:
May 28, 2019
.
Answers (1)
-
(i)Identify the mode of feeding of the animal whose dental formula is shown below
(ii) Give reasons for your answer in (i) above
(Solved)
(i)Identify the mode of feeding of the animal whose dental formula is shown below

(ii) Give reasons for your answer in (i) above
Date posted:
May 28, 2019
.
Answers (1)
-
The diagram below represents a cell as seen under an electron microscope.
a) Identify the parts labeled A and D.
b) State the function of the...
(Solved)
The diagram below represents a cell as seen under an electron microscope.

a) Identify the parts labeled A and D.
b) State the function of the structures found on the part labeled D.
Date posted:
May 28, 2019
.
Answers (1)
-
An experiment was carried out to investigate transpiration and absorption of water in sunflower plants in their natural environment with adequate supply of water. The...
(Solved)
An experiment was carried out to investigate transpiration and absorption of water in sunflower plants in their natural environment with adequate supply of water. The amount of water was determined in two hour intervals. The results are shown in the table below.
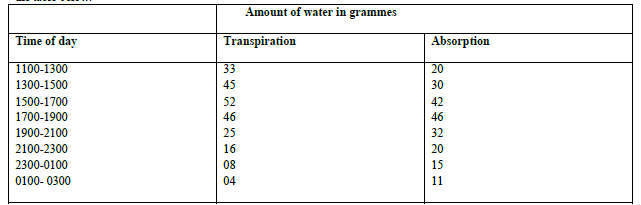
(a) Using the same axes, plot graphs to show transpiration and absorption of water in grammes against time of the day.
(b) At what time of the day was the amount of water the same for transpiration and absorption.
(c) Account for the shape of the graph of
(i) Transpiration
(ii) Absorption
(d) What would happen to transpiration and absorption of water if the experiment was continued till 0050 hours.
(e) Name two factors that may affect transpiration and absorption at any given time.
(f) Explain how the factors you named in (e) above affect transpiration.
Date posted:
May 28, 2019
.
Answers (1)
-
A portion of a nucleic acid is shown below;
a) Name the nucleic acid to which the portion belongs. Give a reason.
b) Write down the...
(Solved)
A portion of a nucleic acid is shown below;

a) Name the nucleic acid to which the portion belongs. Give a reason.
b) Write down the sequence of bases of a complimentary strand to the one above.
Date posted:
May 28, 2019
.
Answers (1)
-
Name two renal diseases.
(Solved)
Name two renal diseases.
Date posted:
May 27, 2019
.
Answers (1)
-
The diagram below illustrate an experiment to demonstrate some aspects of respiration in a potted plant.
(a) Name and state the role of the chemical compound...
(Solved)
The diagram below illustrate an experiment to demonstrate some aspects of respiration in a potted plant.
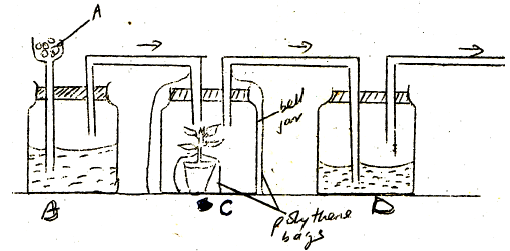
(a) Name and state the role of the chemical compound labeled A
Chemical compound
Role played
(b) What aspect of respiration is being demonstrated?
(c) Name the reagents in set up B and D.
(d) What would be the results in set up B and D after the experiment has run for some time.
Set up B
Set up D
(e) State the importance of covering the bell jar in set up C with a black polythene bag.
(f) Why was it necessary to enclose the pot with a polythene bag.
Date posted:
May 27, 2019
.
Answers (1)
-
Explain why it is difficult for scientist to make a vaccine against plasmodium which causes malaria.
(Solved)
Explain why it is difficult for scientist to make a vaccine against plasmodium which causes malaria.
Date posted:
May 27, 2019
.
Answers (1)
-
Name the hormone involved in development of male secondary sexual characteristics.
(Solved)
Name the hormone involved in development of male secondary sexual characteristics.
Date posted:
May 27, 2019
.
Answers (1)
-
Name the hormone involved in Milk production
(Solved)
Name the hormone involved in Milk production
Date posted:
May 27, 2019
.
Answers (1)
-
State two adaptations of the oviduct in female reproductive system.
(Solved)
State two adaptations of the oviduct in female reproductive system.
Date posted:
May 27, 2019
.
Answers (1)