- Give two reasons why Gold mining in Kenya has not been fully exploited.(Solved)
Give two reasons why Gold mining in Kenya has not been fully exploited.
Date posted: May 28, 2019. Answers (1)
- Outline three human factors that favour tea growing in the Nandi Hills area of Kenya.(Solved)
Outline three human factors that favour tea growing in the Nandi Hills area of Kenya.
Date posted: May 28, 2019. Answers (1)
- Classify the following ocean currents to either warm or cold.
- Agulhas
- Oyashio
- Benguela
- Labrador
- Gulf stream(Solved)
Classify the following ocean currents to either warm or cold.
- Agulhas
- Oyashio
- Benguela
- Labrador
- Gulf stream
Date posted: May 28, 2019. Answers (1)
- Explain how earth’s rotation causes horizontal movement of ocean water.(Solved)
Explain how earth’s rotation causes horizontal movement of ocean water.
Date posted: May 28, 2019. Answers (1)
- Give two examples of landlocked seas(Solved)
Give two examples of landlocked seas
Date posted: May 28, 2019. Answers (1)
- What is a sea?(Solved)
What is a sea?
Date posted: May 28, 2019. Answers (1)
- Differentiate between rock slide and soil creep.(Solved)
Differentiate between rock slide and soil creep.
Date posted: May 28, 2019. Answers (1)
- Explain the importance of studying rocks.(Solved)
Explain the importance of studying rocks.
Date posted: May 28, 2019. Answers (1)
- List two main types of rocks dominant in Kenya.(Solved)
List two main types of rocks dominant in Kenya.
Date posted: May 28, 2019. Answers (1)
- State three factors which determine the amount of sunshine received in an area.(Solved)
State three factors which determine the amount of sunshine received in an area.
Date posted: May 28, 2019. Answers (1)
- What is precipitation?(Solved)
What is precipitation?
Date posted: May 28, 2019. Answers (1)
- Differentiate between a weather station and a Stevenson screen(Solved)
Differentiate between a weather station and a Stevenson screen.
Date posted: May 28, 2019. Answers (1)
- The diagram above represents the internal structure of the earth. Label the parts marked R, S, T, W, V and X.(Solved)
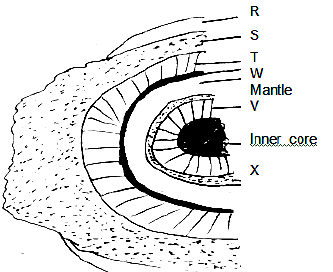
The diagram above represents the internal structure of the earth. Label the parts marked R, S, T, W, V and X.
Date posted: May 28, 2019. Answers (1)
- What are the characteristics of volcanic soils?(Solved)
What are the characteristics of volcanic soils?
Date posted: May 28, 2019. Answers (1)
- What are the characteristics of the soil catena on a steep part of the slope?(Solved)
What are the characteristics of the soil catena on a steep part of the slope?
Date posted: May 28, 2019. Answers (1)
- If the local time in town A at longitude 200E is 10a.m., what will be the time at town B at longitude 100W?(Solved)
If the local time in town A at longitude 200E is 10a.m., what will be the time at town B at longitude 100W?
Date posted: May 28, 2019. Answers (1)
- The pyramid below represents the population structure of Sweden.
Describe the characteristics of population represented by the pyramid.(Solved)
The pyramid below represents the population structure of Sweden.
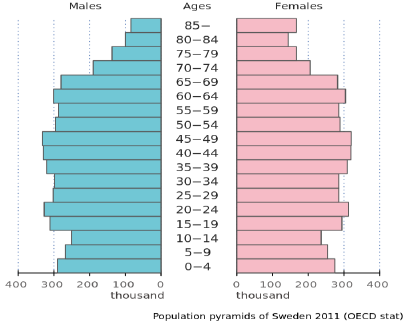
Describe the characteristics of population represented by the pyramid.
Date posted: May 28, 2019. Answers (1)
- What is sex ratio?(Solved)
What is sex ratio?
Date posted: May 28, 2019. Answers (1)
- The map below shows the Great Lakes and St. Lawrence Seaway. Use it to answer question (i) and (ii).
(i)Name the canals marked J and K....(Solved)
The map below shows the Great Lakes and St. Lawrence Seaway. Use it to answer question (i) and (ii).

(i)Name the canals marked J and K.
(ii)Name the towns marked M, N and P.
Date posted: May 28, 2019. Answers (1)
- State two ways in which Kenya would benefit from the construction of the Standard gauge railway.(Solved)
State two ways in which Kenya would benefit from the construction of the Standard gauge railway.
Date posted: May 28, 2019. Answers (1)