- Outline four differences between the functions of Kisumu town and Nairobi City.(Solved)
Outline four differences between the functions of Kisumu town and Nairobi City.
Date posted: May 28, 2019. Answers (1)
- State three reasons why the government encourages Afforestation programmes in the country.(Solved)
State three reasons why the government encourages Afforestation programmes in the country.
Date posted: May 28, 2019. Answers (1)
- State two reasons why the use of waterways from Kisumu to other lake ports has tremendously declined.(Solved)
State two reasons why the use of waterways from Kisumu to other lake ports has tremendously declined.
Date posted: May 28, 2019. Answers (1)
- Use the map of Lake Victoria below to answer question below.
Name the lake ports marked E, F and G.(Solved)
Use the map of Lake Victoria below to answer question below.
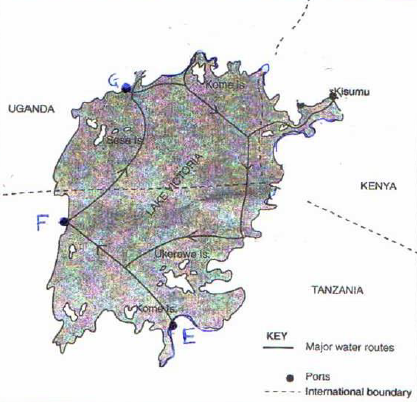
Name the lake ports marked E, F and G.
Date posted: May 28, 2019. Answers (1)
- You are supposed to carry out a field study of an area eroded by underground water.
i) Name two surface features you are likely to identify...(Solved)
You are supposed to carry out a field study of an area eroded by underground water.
i) Name two surface features you are likely to identify during the field study
ii) State four reasons why you would prepare a work schedule
iii) Give three follow –up activities you would engage in:
Date posted: May 28, 2019. Answers (1)
- Distinguish between phreatic and vadose zone.(Solved)
Distinguish between phreatic and vadose zone.
Date posted: May 28, 2019. Answers (1)
- Explain how the following factors influence the existence of ground water.
- Nature of the rocks
- Vegetation cover(Solved)
Explain how the following factors influence the existence of ground water.
- Nature of the rocks
- Vegetation cover
Date posted: May 28, 2019. Answers (1)
- How can rocks be broken up by physical weathering?(Solved)
How can rocks be broken up by physical weathering?
Date posted: May 28, 2019. Answers (1)
- You carried out a field study on faulting in the Rift Valley of Kenya.
i) State two objectives for the study you carried out.
ii) Give three...(Solved)
You carried out a field study on faulting in the Rift Valley of Kenya.
i) State two objectives for the study you carried out.
ii) Give three follow – up activities you may have engaged in.
Date posted: May 28, 2019. Answers (1)
- With the aid of well labeled diagrams describe how a rift valley can be formed by Compressional forces.(Solved)
With the aid of well labeled diagrams describe how a rift valley can be formed by Compressional forces.
Date posted: May 28, 2019. Answers (1)
- State two ways in which plains are formed(Solved)
State two ways in which plains are formed
Date posted: May 28, 2019. Answers (1)
- Name two plains found in Kenya.(Solved)
Name two plains found in Kenya.
Date posted: May 28, 2019. Answers (1)
- Differentiate between meteors and meteorites.(Solved)
Differentiate between meteors and meteorites.
Date posted: May 28, 2019. Answers (1)
- State three planets that have satellites.(Solved)
State three planets that have satellites.
Date posted: May 28, 2019. Answers (1)
- Students of St. Thomas secondary school intends to carry out a field study on types of industries found in
Kabiyet centre.
(i) State two hypotheses that they...(Solved)
Students of St. Thomas secondary school intends to carry out a field study on types of industries found in
Kabiyet centre.
(i) State two hypotheses that they would make on their study.
(ii) Describe what activities they will undertake before the study till they conclude their study.
(iii) Identify two significances of their study.
Date posted: May 28, 2019. Answers (1)
- List two types of industries found in an agricultural zone.(Solved)
List two types of industries found in an agricultural zone.
Date posted: May 28, 2019. Answers (1)
- Define the term ‘Industrial Conurbation.’(Solved)
Define the term ‘Industrial Conurbation.’
Date posted: May 28, 2019. Answers (1)
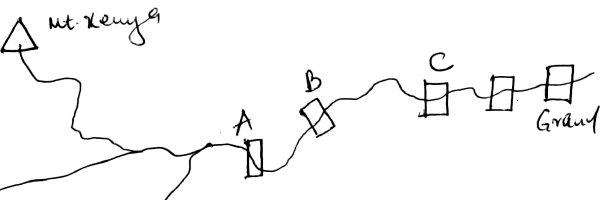
- Identify the hydro-powered stations marked A, B and C in the diagram below.(Solved)
Identify the hydro-powered stations marked A, B and C in the diagram below.
Date posted: May 28, 2019. Answers (1)
- State one community in Kenya engaged in ecotourism.(Solved)
State one community in Kenya engaged in ecotourism.
Date posted: May 28, 2019. Answers (1)
- What is ecotourism?(Solved)
What is ecotourism?
Date posted: May 28, 2019. Answers (1)