- Use the diagram below of a mountain vegetation zone of a mountain in Kenya to answer the following
questions.
(i) Name vegetation zones A, B, C and...(Solved)
Use the diagram below of a mountain vegetation zone of a mountain in Kenya to answer the following
questions.
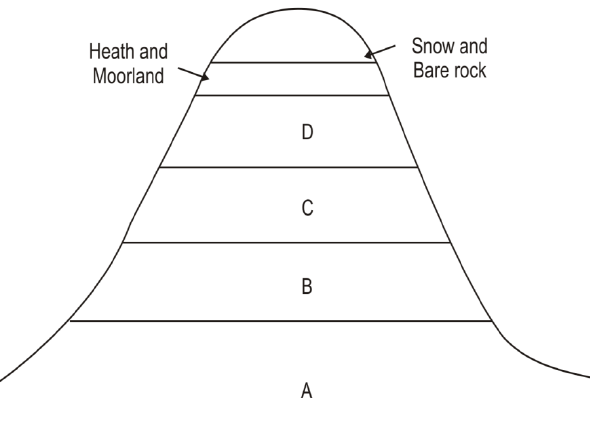
(i) Name vegetation zones A, B, C and D
(ii) Explain three importance of vegetation in zone C
(iii) What is the Government doing to ensure that vegetation in zone B is not destroyed
Date posted: May 28, 2019. Answers (1)
- Explain how each of the following have affected Lakes in Kenya
(i) Deforestation
(ii) Industrialization
(iii) Water needs(Solved)
Explain how each of the following have affected Lakes in Kenya
(i) Deforestation
(ii) Industrialization
(iii) Water needs
Date posted: May 28, 2019. Answers (1)
- State three importance of artesian basin(Solved)
State three importance of artesian basin
Date posted: May 28, 2019. Answers (1)
- Describe the occurrence of compressional forces(Solved)
Describe the occurrence of compressional forces
Date posted: May 28, 2019. Answers (1)
- Name fold mountains found in the following continents
(i) South America
(ii) South Africa
(iii) Europe(Solved)
Name fold mountains found in the following continents
(i) South America
(ii) South Africa
(iii) Europe
Date posted: May 28, 2019. Answers (1)
- Use the diagram below to answer the question that follows.
Outline the process through which moist winds shown go through to eventually become dry winds(Solved)
Use the diagram below to answer the question that follows.
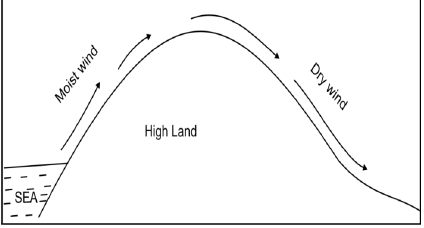
Outline the process through which moist winds shown go through to eventually become dry winds
Date posted: May 28, 2019. Answers (1)
- Study the table below that shows Kenya’s visible balance of Trade with some selected countries. 1982-1984 ( figures in pounds ‘000).
i) Draw a comparative line...(Solved)
Study the table below that shows Kenya’s visible balance of Trade with some selected countries. 1982-1984 ( figures in pounds ‘000).
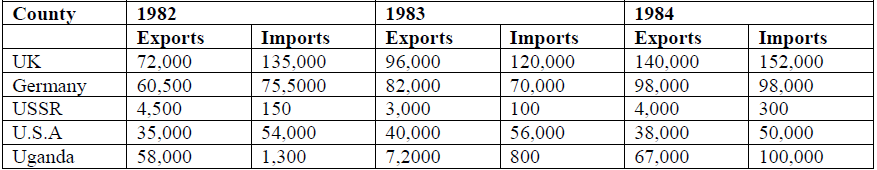
i) Draw a comparative line graph showing the exports from 1982 to 1984 using a vertical scale of 1:10 million and horizontal scale.
ii) State three disadvantages of this graph experienced during the construction.
Date posted: May 28, 2019. Answers (1)
- Explain three ways in which vegetation protects the soil from degeneration.(Solved)
Explain three ways in which vegetation protects the soil from degeneration.
Date posted: May 28, 2019. Answers (1)
- Describe calcification as a leaching process in soil formation.(Solved)
Describe calcification as a leaching process in soil formation.
Date posted: May 28, 2019. Answers (1)
- You carried out a field study in a region on the effects of faulting on human activities.
i) State one hypothesis of your study.
ii) State...(Solved)
You carried out a field study in a region on the effects of faulting on human activities.
i) State one hypothesis of your study.
ii) State three problems you experienced during the study.
iii) State three finding on the positive effects of faulting on human activities.
Date posted: May 28, 2019. Answers (1)
- Distinguish between a coast and a shore.(Solved)
Distinguish between a coast and a shore.
Date posted: May 28, 2019. Answers (1)
- State three characteristics of the crust.(Solved)
State three characteristics of the crust.
Date posted: May 28, 2019. Answers (1)
- State two forces that shape the surface of the earth.(Solved)
State two forces that shape the surface of the earth.
Date posted: May 28, 2019. Answers (1)
- You intend to carry out a field study of a heavy manufacturing industry;
i) State three effects of the industry on the environment you are likely...(Solved)
You intend to carry out a field study of a heavy manufacturing industry;
i) State three effects of the industry on the environment you are likely to observe.
ii) Design a working programme (schedule) you would use during the day of study.
iii) State three reasons why it is important to prepare a working programme (schedule) for the study.
Date posted: May 28, 2019. Answers (1)
- Outline four similarities between Jua Kali industry in Kenya and cottage industry in India.(Solved)
Outline four similarities between Jua Kali industry in Kenya and cottage industry in India.
Date posted: May 28, 2019. Answers (1)
- State three reasons why some industries consider regular supply of water as the main reason for their
location.(Solved)
State three reasons why some industries consider regular supply of water as the main reason for their
location.
Date posted: May 28, 2019. Answers (1)
- Explain three ways in which the Masai Mara game reserves benefits the local Maasai community.(Solved)
Explain three ways in which the Masai Mara game reserves benefits the local Maasai community.
Date posted: May 28, 2019. Answers (1)
- Apart from establishing national parks and game reserves, outline four ways in which wildlife is being
conserved in Kenya.(Solved)
Apart from establishing national parks and game reserves, outline four ways in which wildlife is being
conserved in Kenya.
Date posted: May 28, 2019. Answers (1)
- Explain four consequences of slow population growth rate to a country.(Solved)
Explain four consequences of slow population growth rate to a country.
Date posted: May 28, 2019. Answers (1)
- Explain three economic factors that influence population distribution in East Africa.(Solved)
Explain three economic factors that influence population distribution in East Africa.
Date posted: May 28, 2019. Answers (1)