- Your class is to carry out a field study in an area of polluted soil.
i. Give two objectives of your study.
ii. Give two negative...(Solved)
Your class is to carry out a field study in an area of polluted soil.
i. Give two objectives of your study.
ii. Give two negative affects you may identify that could have been caused by the polluted soil.
iii. What is the likely cause of the soil pollution in the area of study.
Date posted: May 28, 2019. Answers (1)
- Describe how the following lakes were formed
- Lake Masinga
- Lake Kanyaboli(Solved)
Describe how the following lakes were formed
- Lake Masinga
- Lake Kanyaboli
Date posted: May 28, 2019. Answers (1)
- Your class is planning to carry out a field study of a river in its youthful stage.
i. Formulate three hypothesis for your study.
ii. Give...(Solved)
Your class is planning to carry out a field study of a river in its youthful stage.
i. Formulate three hypothesis for your study.
ii. Give three reasons why it would be necessary to write a work schedule for the study.
iii. In what ways would you record the data collected from the study.
Date posted: May 28, 2019. Answers (1)
- Give two ways in which rivers can improve food security in a region.(Solved)
Give two ways in which rivers can improve food security in a region.
Date posted: May 28, 2019. Answers (1)
- Outline two factors that may lead to the flooding of a river with natural levees.(Solved)
Outline two factors that may lead to the flooding of a river with natural levees.
Date posted: May 28, 2019. Answers (1)
- Describe the process of block separation in mechanical weathering.(Solved)
Describe the process of block separation in mechanical weathering.
Date posted: May 28, 2019. Answers (1)
- Define the term denudation.(Solved)
Define the term denudation.
Date posted: May 28, 2019. Answers (1)
- Describe how gravitative pressure can cause earth movements.(Solved)
Describe how gravitative pressure can cause earth movements.
Date posted: May 28, 2019. Answers (1)
- State four reasons why there is a decline in the number of tourist visiting Kenya in the year 2007/2008(Solved)
State four reasons why there is a decline in the number of tourist visiting Kenya in the year 2007/2008
Date posted: May 28, 2019. Answers (1)
- Give four reasons why the government of Kenya should promote eco-tourism(Solved)
Give four reasons why the government of Kenya should promote eco-tourism
Date posted: May 28, 2019. Answers (1)
- Differentiate between Ecotourism and Domestic Tourism(Solved)
Differentiate between Ecotourism and Domestic Tourism
Date posted: May 28, 2019. Answers (1)
- State three human factors influencing the growth of coffee(Solved)
State three human factors influencing the growth of coffee
Date posted: May 28, 2019. Answers (1)
- Name two areas in Kenya where coffee is grown.(Solved)
Name two areas in Kenya where coffee is grown
Date posted: May 28, 2019. Answers (1)
- Use the table below showing numbers of livestock in Kenya between 2000 and 2003 in thousands.
(i) Use the above data of livestock in Kenya to...(Solved)
Use the table below showing numbers of livestock in Kenya between 2000 and 2003 in thousands.
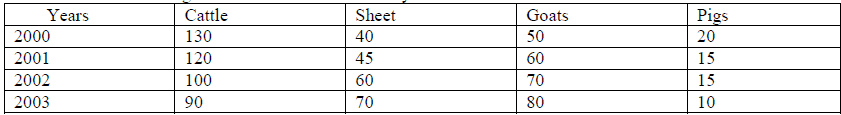
(i) Use the above data of livestock in Kenya to draw a cumulative bar graph
(ii) Explain the trend of cattle and give one possible reason for such a trend
Date posted: May 28, 2019. Answers (1)
- Use the diagram below of a mountain vegetation zone of a mountain in Kenya to answer the following
questions.
(i) Name vegetation zones A, B, C and...(Solved)
Use the diagram below of a mountain vegetation zone of a mountain in Kenya to answer the following
questions.
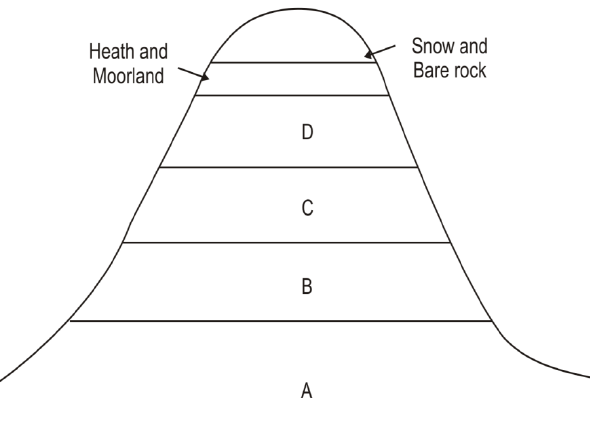
(i) Name vegetation zones A, B, C and D
(ii) Explain three importance of vegetation in zone C
(iii) What is the Government doing to ensure that vegetation in zone B is not destroyed
Date posted: May 28, 2019. Answers (1)
- Explain how each of the following have affected Lakes in Kenya
(i) Deforestation
(ii) Industrialization
(iii) Water needs(Solved)
Explain how each of the following have affected Lakes in Kenya
(i) Deforestation
(ii) Industrialization
(iii) Water needs
Date posted: May 28, 2019. Answers (1)
- State three importance of artesian basin(Solved)
State three importance of artesian basin
Date posted: May 28, 2019. Answers (1)
- Describe the occurrence of compressional forces(Solved)
Describe the occurrence of compressional forces
Date posted: May 28, 2019. Answers (1)
- Name fold mountains found in the following continents
(i) South America
(ii) South Africa
(iii) Europe(Solved)
Name fold mountains found in the following continents
(i) South America
(ii) South Africa
(iii) Europe
Date posted: May 28, 2019. Answers (1)
- Use the diagram below to answer the question that follows.
Outline the process through which moist winds shown go through to eventually become dry winds(Solved)
Use the diagram below to answer the question that follows.
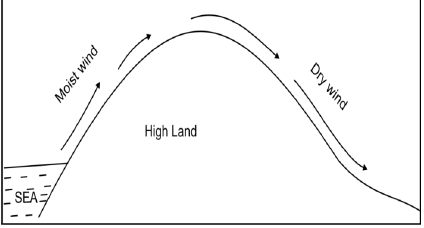
Outline the process through which moist winds shown go through to eventually become dry winds
Date posted: May 28, 2019. Answers (1)