- Give three physical conditions that favour maize cultivation in Nakuru county in Kenya.(Solved)
Give three physical conditions that favour maize cultivation in Nakuru county in Kenya.
Date posted: May 29, 2019. Answers (1)
- Some geography students intend to carry out a field study of an area under the effect of soil.
(i) Name two types of soil erosion they...(Solved)
Some geography students intend to carry out a field study of an area under the effect of soil.
(i) Name two types of soil erosion they are likely to identify during the study.
(ii) State four soils conservation measures they are likely to recommend to the residents of the stuffy area.
Date posted: May 29, 2019. Answers (1)
- Study the world map below and answer the questions that follow.
(a) (i) Name the climatic region marked B and D.
(ii)...(Solved)
Study the world map below and answer the questions that follow.
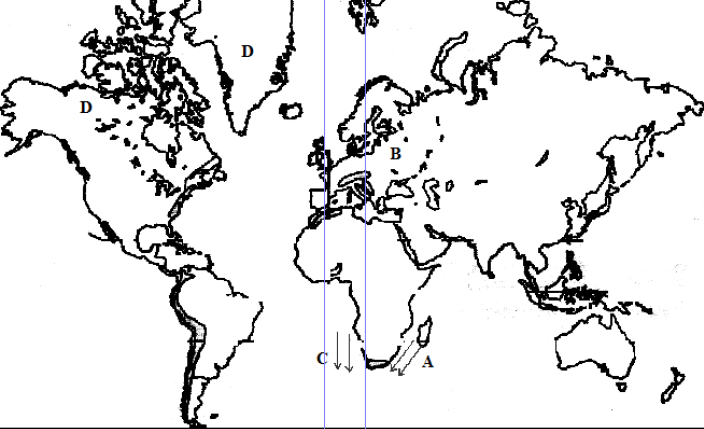
(a) (i) Name the climatic region marked B and D.
(ii) Name the ocean currents marked C and A.
(b) Describe the characteristics of the vegetation marked T.
(c) Explain how the vegetation in the area marked B adapt itself to the climatic conditions.
Date posted: May 29, 2019. Answers (1)
- Name two main seasons caused by the revolution of the earth.(Solved)
Name two main seasons caused by the revolution of the earth.
Date posted: May 29, 2019. Answers (1)
- The diagram below shows relief rainfall.
(i) Name the areas marked X and Y.
(ii) State three characteristics of the region marked Y.(Solved)
The diagram below shows relief rainfall.
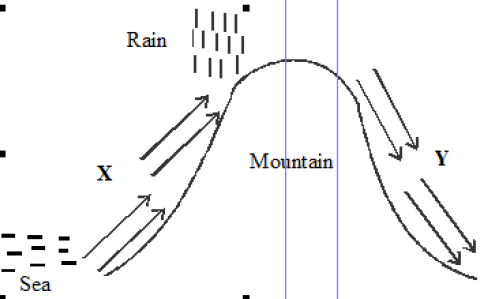
(i) Name the areas marked X and Y.
(ii) State three characteristics of the region marked Y.
Date posted: May 29, 2019. Answers (1)
- Name three countries where the Trans-African railway line is not completed.(Solved)
Name three countries where the Trans-African railway line is not completed.
Date posted: May 29, 2019. Answers (1)
- The map below shows the proposed Trans-African railway and the Great North road.
Name the towns marked J, K and L on Great North road.(Solved)
The map below shows the proposed Trans-African railway and the Great North road.
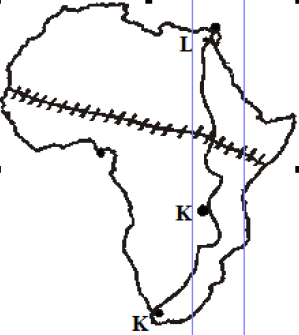
Name the towns marked J, K and L on Great North road.
Date posted: May 29, 2019. Answers (1)
- The data below represents sugarcane production in five major factories in Kenya.
Use it to answer questions below.
Factory Production in...(Solved)
The data below represents sugarcane production in five major factories in Kenya.
Use it to answer questions below.
Factory Production in “000” tonnes
Sony 50
Nzoia 100
Chemelil 200
Muhoroni 250
Mumias 400
(i) Using the data above, draw a divided rectangle measuring 15cm in length.
(ii) Give the difference in tonnage produced by Muhoroni and Nzoia companies.
(iii) State two advantages of representing data using divided rectangles.
Date posted: May 29, 2019. Answers (1)
- State three evidences of soil creep in a given area.(Solved)
State three evidences of soil creep in a given area.
Date posted: May 29, 2019. Answers (1)
- The diagram below shows zones of underground water. Use it to answer the question.
Name the zones marked R, S and T.(Solved)
The diagram below shows zones of underground water. Use it to answer the question.
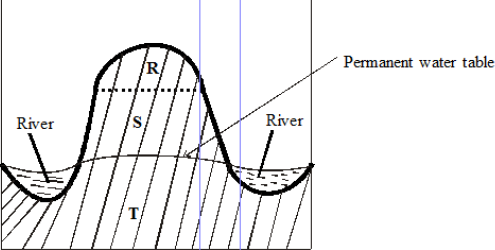
Name the zones marked R, S and T.
Date posted: May 28, 2019. Answers (1)
- Use the map of Kenya below to answer questions below.
(i) Identify the lake labelled W and mountain labelled X.
(ii) Explain how the lake named in...(Solved)
Use the map of Kenya below to answer questions below.
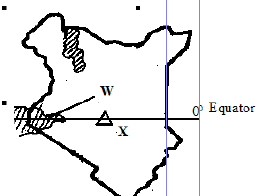
(i) Identify the lake labelled W and mountain labelled X.
(ii) Explain how the lake named in (i) above influences the climate of the surrounding areas.
Date posted: May 28, 2019. Answers (1)
- The diagram below represents a coastal landform.
Name the features marked P and Q.(Solved)
The diagram below represents a coastal landform.
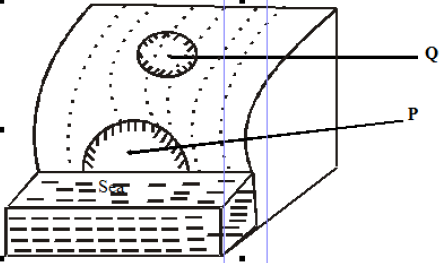
Name the features marked P and Q.
Date posted: May 28, 2019. Answers (1)
- State two ways in which downwash occurs.(Solved)
State two ways in which downwash occurs.
Date posted: May 28, 2019. Answers (1)
- Students from a school in mount Kenya region carried out a field study on forests around their school.
i. Name two types of softwood trees they...(Solved)
Students from a school in mount Kenya region carried out a field study on forests around their school.
i. Name two types of softwood trees they may have come across.
ii. Give two problems they may have experienced during field study
Date posted: May 28, 2019. Answers (1)
- State four environmental and ecological benefits of forests.(Solved)
State four environmental and ecological benefits of forests.
Date posted: May 28, 2019. Answers (1)
- The map below shows world distribution of forests. Use it to answer questions below.
Name the forest vegetation marked x and y
Explain four ways in which...(Solved)
The map below shows world distribution of forests. Use it to answer questions below.
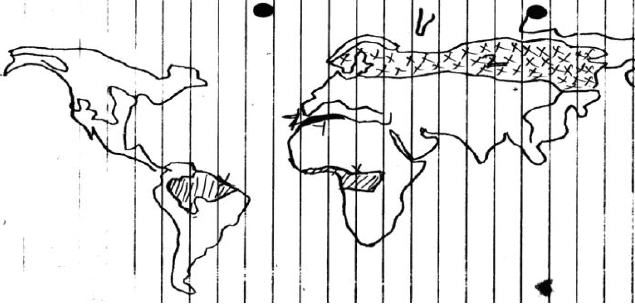
Name the forest vegetation marked x and y
Explain four ways in which the forest vegetation marked z has adopted to climatic conditions in the area.
Date posted: May 28, 2019. Answers (1)
- Use the table below to answer the following question
Transport value output 2006-2009 minimum in Kenya
a)i) Draw a comparative bar graph for the Road, Air and...(Solved)
Use the table below to answer the following question
Transport value output 2006-2009 minimum in Kenya
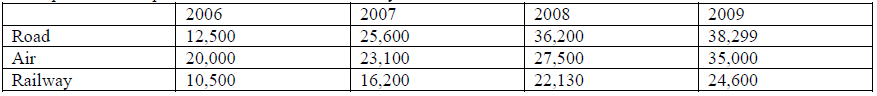
a)i) Draw a comparative bar graph for the Road, Air and Railway transport between the year 2006-
2009
ii) Analyze and interpret the graph you have drawn
b) Calculate the total transport for the year 2008
Date posted: May 28, 2019. Answers (1)
- Your class is to carry out a field study in an area of polluted soil.
i. Give two objectives of your study.
ii. Give two negative...(Solved)
Your class is to carry out a field study in an area of polluted soil.
i. Give two objectives of your study.
ii. Give two negative affects you may identify that could have been caused by the polluted soil.
iii. What is the likely cause of the soil pollution in the area of study.
Date posted: May 28, 2019. Answers (1)
- Describe how the following lakes were formed
- Lake Masinga
- Lake Kanyaboli(Solved)
Describe how the following lakes were formed
- Lake Masinga
- Lake Kanyaboli
Date posted: May 28, 2019. Answers (1)
- Your class is planning to carry out a field study of a river in its youthful stage.
i. Formulate three hypothesis for your study.
ii. Give...(Solved)
Your class is planning to carry out a field study of a river in its youthful stage.
i. Formulate three hypothesis for your study.
ii. Give three reasons why it would be necessary to write a work schedule for the study.
iii. In what ways would you record the data collected from the study.
Date posted: May 28, 2019. Answers (1)