- Use the map of Ruhr Industrial zone below to answer question below.
Name the towns marked M and N.(Solved)
Use the map of Ruhr Industrial zone below to answer question below.
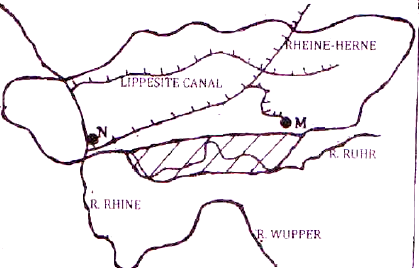
Name the towns marked M and N.
Date posted: May 29, 2019. Answers (1)
- What is weather forecasting?(Solved)
What is weather forecasting?
Date posted: May 29, 2019. Answers (1)
- The table below shows rainfall and temperature figures of a station in Africa. Use it to answer questions below
i) Calculate annual range of temperature (show...(Solved)
The table below shows rainfall and temperature figures of a station in Africa. Use it to answer questions below
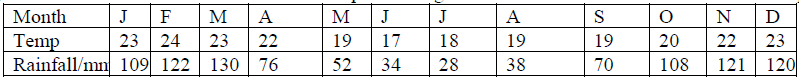
i) Calculate annual range of temperature (show your calculation)
ii) Calculate the annual rainfall.
Date posted: May 29, 2019. Answers (1)
- State three cultural practices that contribute to high birth rate in Kenya(Solved)
State three cultural practices that contribute to high birth rate in Kenya
Date posted: May 29, 2019. Answers (1)
- Your class visited a Jua Kali industry in the near by town
(i) State three reasons why you were required to carry out a pre-visit
(ii) State...(Solved)
Your class visited a Jua Kali industry in the near by town
(i) State three reasons why you were required to carry out a pre-visit
(ii) State two problems facing Jua Kali artisan in Kenya you were likely to identify
Date posted: May 29, 2019. Answers (1)
- Explain two likely effects of recent oil discovery to the economy of Kenya(Solved)
Explain two likely effects of recent oil discovery to the economy of Kenya
Date posted: May 29, 2019. Answers (1)
- The table below shows the number of tourists who visited East African Countries from other parts of the world. Use it to answer question below....(Solved)
The table below shows the number of tourists who visited East African Countries from other parts of the world. Use it to answer question below. In the Rift Valley Province in ( 000,000)
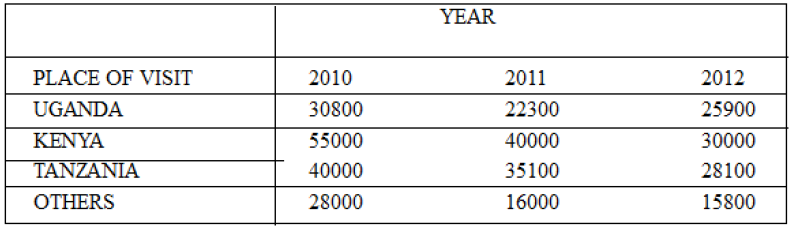
Using a vertical scale of 1cm to represent 5000
Draw a comparative bar graph to represent the data above
Date posted: May 29, 2019. Answers (1)
- State two major causes of noise pollution in urban centres.(Solved)
State two major causes of noise pollution in urban centres
Date posted: May 29, 2019. Answers (1)
- Give three reasons why hardwood tree species in Kenya are in danger of extinction(Solved)
Give three reasons why hardwood tree species in Kenya are in danger of extinction
Date posted: May 29, 2019. Answers (1)
- Name two rift systems in Africa(Solved)
Name two rift systems in Africa.
Date posted: May 29, 2019. Answers (1)
- The table below shows temperature and rainfall figures for Transtein , Germany . Use it to answer the
questions that follows.
(a) Calculate the annual range of...(Solved)
The table below shows temperature and rainfall figures for Transtein , Germany . Use it to answer the
questions that follows.
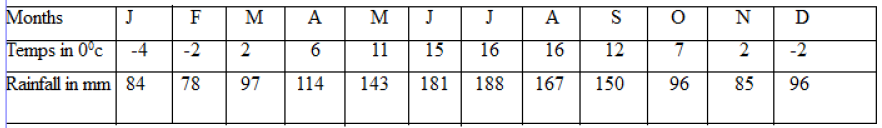
(a) Calculate the annual range of temperature
(b) Describe the climate of the above station
Date posted: May 29, 2019. Answers (1)
- Describe the characteristics of the following layers of the earth’s structure
(i) Lithosphere (crust)
(ii) The core(Solved)
Describe the characteristics of the following layers of the earth’s structure
(i) Lithosphere (crust)
(ii) The core
Date posted: May 29, 2019. Answers (1)
- What is physical environment?(Solved)
What is physical environment?
Date posted: May 29, 2019. Answers (1)
- A from four class carried out a field study on industrialization in Thika town.
(i) Give two possible objectives of their study.
(ii) List two methods...(Solved)
A from four class carried out a field study on industrialization in Thika town.
(i) Give two possible objectives of their study.
(ii) List two methods of data recording that they will use to record the data.
Date posted: May 29, 2019. Answers (1)
- Describe the measures which should be taken by the Kenyan government to control effects of industrialization.(Solved)
Describe the measures which should be taken by the Kenyan government to control effects of industrialization.
Date posted: May 29, 2019. Answers (1)
- Give four reasons why Kenya should become an industrialized country as per the vision 2030.(Solved)
Give four reasons why Kenya should become an industrialized country as per the vision 2030.
Date posted: May 29, 2019. Answers (1)
- Identify the main industries found in each of the following towns.
- Kisumu
- Nakuru(Solved)
Identify the main industries found in each of the following towns.
- Kisumu
- Nakuru
Date posted: May 29, 2019. Answers (1)
- Explain how the following factors hinder transport and communication in Africa.
- Terrain.
- Shortage of skilled labour.(Solved)
Explain how the following factors hinder transport and communication in Africa.
- Terrain.
- Shortage of skilled labour.
Date posted: May 29, 2019. Answers (1)
- Draw a sketch map of the Great Lakes and St. Lawrence Seaway. On it mark and name the following:-
- Lakes Michigan and Ontario.
- Ports...(Solved)
Draw a sketch map of the Great Lakes and St. Lawrence Seaway. On it mark and name the following:-
- Lakes Michigan and Ontario.
- Ports Duluth and Chicago.
Date posted: May 29, 2019. Answers (1)
- Outline three benefits derived from the construction of Nairobi-Thika super highway.(Solved)
Outline three benefits derived from the construction of Nairobi-Thika super highway.
Date posted: May 29, 2019. Answers (1)