- State what is observed on the screen of a CRO when :
i) low voltage alternating current is connected to the time base and the y-gain...(Solved)
State what is observed on the screen of a CRO when :
i) low voltage alternating current is connected to the time base and the y-gain switched off.
ii) a high voltage ac is connected to the y-gain and the time base is switched off.
Date posted: May 30, 2019. Answers (1)
- An object forms a virtual image three times the size of the object. If the object is placed 10cm from the lens.
Determine :
i) the image...(Solved)
An object forms a virtual image three times the size of the object. If the object is placed 10cm from the lens.
Determine :
i) the image distance from lens.
ii) the focal length of the lens
Date posted: May 30, 2019. Answers (1)
- The figure below shows a path of a ray of light through a glass prism. The refractive index of glass is 1.52 and the rays
makes...(Solved)
The figure below shows a path of a ray of light through a glass prism. The refractive index of glass is 1.52 and the rays
makes an angle of 40o with the prism.
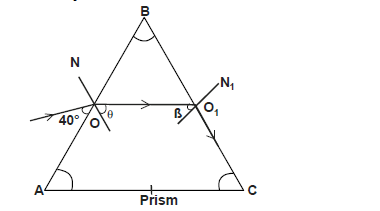
ON and O1N1 are normals to the prism at the faces AB and BC respectively. If the speed of light in air is 3 x 10⁸m/s. Determine :
i) the speed of light in glass
ii) the angles marked
I. angle theta
II. angle beta
Date posted: May 30, 2019. Answers (1)
- Name a device that can be used to improve on the nature of the output current.(Solved)
Name a device that can be used to improve on the nature of the output current.
Date posted: May 30, 2019. Answers (1)
- The figure below shows four pieces of a device used in full wave rectification.
i) Name the devices B1, B2, B3 and B4
ii) Complete the...(Solved)
The figure below shows four pieces of a device used in full wave rectification.
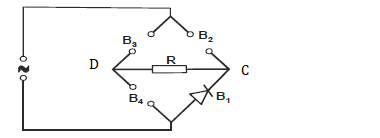
i) Name the devices B1, B2, B3 and B4
ii) Complete the diagram by showing the correct directions of B2, B3 and B4
iii) Use an arrow to show the direction of current flow through R.
iv) Sketch the output current as would be observed on the screen of a CRO fixed between C and D.
Date posted: May 30, 2019. Answers (1)
- In an X-ray tube, the electrons are accelerated by a p.d of 24000V. Assuming that 2% of energy produced is converted
to X-rays. Determine the :
i)...(Solved)
In an X-ray tube, the electrons are accelerated by a p.d of 24000V. Assuming that 2% of energy produced is converted
to X-rays. Determine the :
i) energy of the X-rays produced.
ii) frequency of X-rays produced (take planks constant h = 6.6 x 10⁻³⁴Js and charge on an electron e= 1.6 x 10⁻¹⁹C)
Date posted: May 30, 2019. Answers (1)
- The figure below shows the circuits close to each other.
When the switch is closed, the galvanometer shows a reading and then returns to zero.
i) Explain...(Solved)
The figure below shows the circuits close to each other.
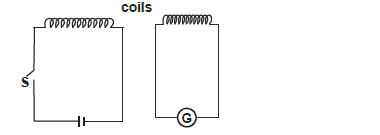
When the switch is closed, the galvanometer shows a reading and then returns to zero.
i) Explain the observation
ii) Give one adjustment that can be done to the arrangement so that
I. the galvanometer gives a bigger deflection in the same direction.
II. the galvanometer deflects in opposite direction when the switch is closed.
Date posted: May 30, 2019. Answers (1)
- The figure below shows an electrical circuit with three capacitors A, B and C.
Determine :
i) the current flowing in the system.
ii) the total...(Solved)
The figure below shows an electrical circuit with three capacitors A, B and C.
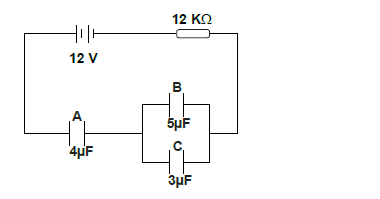
Determine :
i) the current flowing in the system.
ii) the total capacitance of the capacitors.
iii) the total charge stored in the capacitors.
iv) The time needed to fully charge the capacitors.
Date posted: May 30, 2019. Answers (1)
- The figure below shows two parallel plate capacitors connected to a battery. Initially the switch S is open.
The switch is now closed and left for...(Solved)
The figure below shows two parallel plate capacitors connected to a battery. Initially the switch S is open.
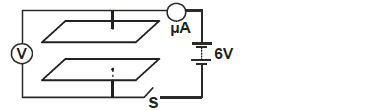
The switch is now closed and left for a few seconds.
i) In the space below sketch a graph of current reading with time from time the switch is closed.
ii) Determine the reading of V after a long time.
iii) How does the capacitance of the plates change when the plates are moved further apart.
Date posted: May 30, 2019. Answers (1)
- The figure below shows an object and its image on a concave mirror. It is drawn to a scale of 1 : 10
Using a ray...(Solved)
The figure below shows an object and its image on a concave mirror. It is drawn to a scale of 1 : 10
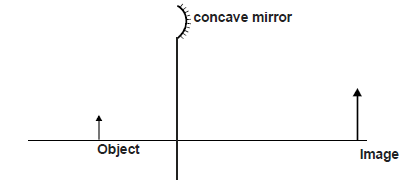
Using a ray from the object, determine
a) the position of the principal focus.
b) the focal length of the mirror
Date posted: May 30, 2019. Answers (1)
- Uranium U 234 decays to Polonium P 218 by emitting alpha particles. Determine the number of alpha particles emitted.(Solved)
Uranium U 234 decays to Polonium P 218 by emitting alpha particles. Determine the number of alpha particles emitted.
Date posted: May 30, 2019. Answers (1)
- Name one electromagnetic wave whose energy is higher than that of visible light.(Solved)
Name one electromagnetic wave whose energy is higher than that of visible light.
Date posted: May 30, 2019. Answers (1)
- The table below shows some electrical appliances to be used in a house. The electrical rating for each appliance is shown.
a) Determine the resistance of...(Solved)
The table below shows some electrical appliances to be used in a house. The electrical rating for each appliance is shown.
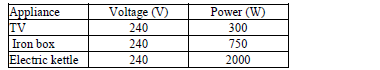
a) Determine the resistance of the coil of the TV set.
b) Determine the appropriate current of each fuse used in the house.
Date posted: May 30, 2019. Answers (1)
- The figure below shows a tuning fork producing waves. The wave fronts are as in the diagram.
If the speed of sound in air is 330m/s....(Solved)
The figure below shows a tuning fork producing waves. The wave fronts are as in the diagram.
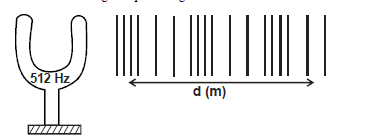
If the speed of sound in air is 330m/s. Determine the value of d.
Date posted: May 30, 2019. Answers (1)
- It is advisable to top up acid level of an accumulator with distilled water and not acid. Give a reason for this.(Solved)
It is advisable to top up acid level of an accumulator with distilled water and not acid. Give a reason for this.
Date posted: May 30, 2019. Answers (1)
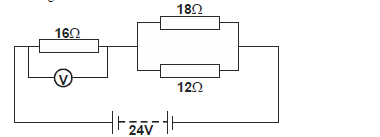
- The figure below shows three resistors and a p.d of 24V across the resistors.Determine the reading of the voltmeter V.(Solved)
The figure below shows three resistors and a p.d of 24V across the resistors.Determine the reading of the voltmeter V.
Date posted: May 30, 2019. Answers (1)
- For an echo to be heard, the minimum distance between the obstacle and the observer must be 17m.If the minimum time for hearing an echo...(Solved)
For an echo to be heard, the minimum distance between the obstacle and the observer must be 17m.If the minimum time for hearing an echo is 0.1 seconds. Determine the speed of sound in air.
Date posted: May 30, 2019. Answers (1)
- The figure below shows plane waves incident on a plane reflector inclined at 60oC to the horizontal.
Complete the diagram to show reflected waves.(Solved)
The figure below shows plane waves incident on a plane reflector inclined at 60oC to the horizontal.
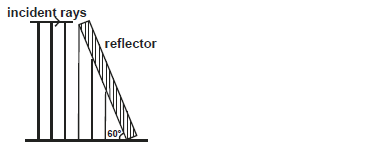
Complete the diagram to show reflected waves.
Date posted: May 30, 2019. Answers (1)
- The figure below shows a plane mirror and the word PHYSICS written on its front.
On the same diagram, write down the appearance of the word...(Solved)
The figure below shows a plane mirror and the word PHYSICS written on its front.
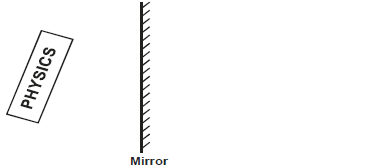
On the same diagram, write down the appearance of the word after reflection on the mirror.
Date posted: May 30, 2019. Answers (1)
- The figure below shows a balloon held under water in a container by a string tied to the bottom of the container.
Explain the change in...(Solved)
The figure below shows a balloon held under water in a container by a string tied to the bottom of the container.
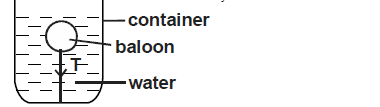
Explain the change in the value of the tension T, as the water gets heated.
Date posted: May 30, 2019. Answers (1)