- The figure below shows the construction and circuit of the modern physics X-ray tube.
a) Indicate on the diagram the path of the x-ray beam.
b)...(Solved)
The figure below shows the construction and circuit of the modern physics X-ray tube.
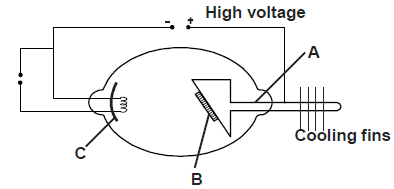
a) Indicate on the diagram the path of the x-ray beam.
b) Name the part marked C and state its function
c) Name the metal used in parts A and B and state why they are suitable for use in the tube.
d) Why are cooling fins necessary?
Date posted: May 30, 2019. Answers (1)
- Explain why it is not advisable to use a 10A fuse for a hair dryer rated 2.5Kw, 240V.(Solved)
Explain why it is not advisable to use a 10A fuse for a hair drier rated 2.5Kw, 240V.
Date posted: May 30, 2019. Answers (1)
- State how polarization is reduced in a simple cell.(Solved)
State how polarization is reduced in a simple cell.
Date posted: May 30, 2019. Answers (1)
- Give one reason why sound is not classified as an electromagnetic wave.(Solved)
Give one reason why sound is not classified as an electromagnetic wave.
Date posted: May 30, 2019. Answers (1)
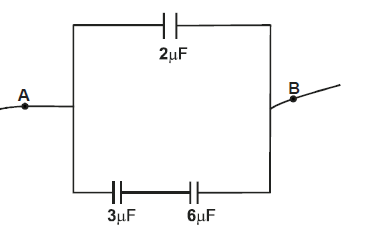
- Find the combined capacitance between points A and B of the arrangement shown in the figure below.(Solved)
Find the combined capacitance between points A and B of the arrangement shown in the figure below.
Date posted: May 30, 2019. Answers (1)
- Explain why the cathode of a CRO is coated with oxides of metals such as Barium and Strontium.(Solved)
Explain why the cathode of a CRO is coated with oxides of metals such as Barium and Strontium.
Date posted: May 30, 2019. Answers (1)
- The diagram in the figure 5.0 below shows an object O placed infront of a converging lens.
Using ray diagram determine the position of the image.(Solved)
The diagram in the figure 5.0 below shows an object O placed infront of a converging lens.
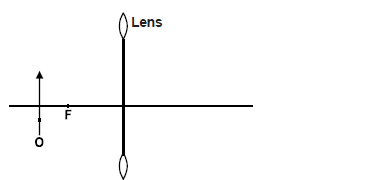
Using ray diagram determine the position of the image.
Date posted: May 30, 2019. Answers (1)
- State what happens to the depletion layer when
a) A diode is forward biased.
b) A diode is reverse biased.(Solved)
State what happens to the depletion layer when
a) A diode is forward biased.
b) A diode is reverse biased.
Date posted: May 30, 2019. Answers (1)
- The figure below shows the cloud chamber tracks of a certain radioactive emission.
State three properties of the radioactive emission producing the tracks shown in...(Solved)
The figure below shows the cloud chamber tracks of a certain radioactive emission.
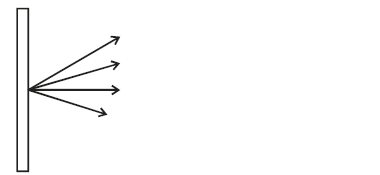
State three properties of the radioactive emission producing the tracks shown in the figure above.
Date posted: May 30, 2019. Answers (1)
- Below is part of radioactive decay series of Uranium 238.
Identify isotopes from series above.(Solved)
Below is part of radioactive decay series of Uranium 238.
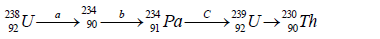
Identify isotopes from series above.
Date posted: May 30, 2019. Answers (1)
- The figure below shows a coil and a magnet being removed from the coil.
a) State the polarity gained at end B.
b) Indicate the direction...(Solved)
The figure below shows a coil and a magnet being removed from the coil.
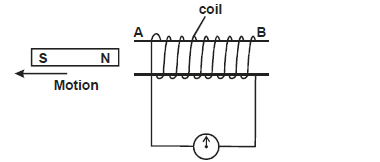
a) State the polarity gained at end B.
b) Indicate the direction of flow of current on the coil.
Date posted: May 30, 2019. Answers (1)
- A ray from a source X makes an angle of 30° with a plane reflector and a ray from a source Y makes an angle...(Solved)
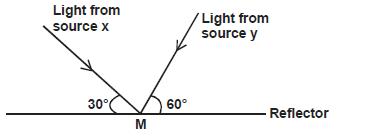
A ray from a source X makes an angle of 30° with a plane reflector and a ray from a source Y makes an angle of 60° to the
same reflector at the same point M as shown below. Find the angle through which the reflector at the same point M as shown
below. Find the angle through which the reflector must be rotated about M such that the ray from the source Y falls on the
source X.
Date posted: May 30, 2019. Answers (1)
- A box of mass 500g has dimension 10m × 5m × 3m. Determine the maximum pressure exerted by the box on a flat surface. (Take...(Solved)
A box of mass 500g has dimension 10m × 5m × 3m. Determine the maximum pressure exerted by the box on a flat surface. (Take g = 10N/kg)
Date posted: May 30, 2019. Answers (1)
- The figure below represents a hydraulic brake.
A force of 20N is applied on the foot pedal connected to a piston of area 0.0005m² and this...(Solved)
The figure below represents a hydraulic brake.

A force of 20N is applied on the foot pedal connected to a piston of area 0.0005m² and this causes a stopping force of 5000N. Calculate
i) The pressure in the master cylinder.
ii) The area of the slave piston.
iii) The velocity ratio
Date posted: May 30, 2019. Answers (1)
- A driver driving a car of mass 1200kg at a constant speed of 72km/h is flagged down by a traffic police officer 145m
away. It takes...(Solved)
A driver driving a car of mass 1200kg at a constant speed of 72km/h is flagged down by a traffic police officer 145m
away. It takes him 2 seconds to react to the police signal and brings the car to rest by applying a constant breaking force in 10 seconds. Determine.
i) The minimum stopping distance.
ii) State whether it will hit the traffic police officer or not.
Date posted: May 30, 2019. Answers (1)
- A bus of mass 5,000kg and a car of mass 1200kg are both travelling on a dual carriage way at the same velocity. If both
drivers...(Solved)
A bus of mass 5,000kg and a car of mass 1200kg are both travelling on a dual carriage way at the same velocity. If both
drivers apply the same breaking force. State with reason which one will come to stop first.
Date posted: May 30, 2019. Answers (1)
- The weight of cube in air is 0.25N. When immersed in water, it weighs 0.44N and when in oil weighs 0.46N. Calculate the relative density...(Solved)
The weight of cube in air is 0.25N. When immersed in water, it weighs 0.44N and when in oil weighs 0.46N. Calculate the relative density of the oil.
Date posted: May 30, 2019. Answers (1)
- A block of glass of mass 0.25kg floats in mercury of density 1.36 × 10⁴kg/m³. What volume of the glass lies under the surface of...(Solved)
A block of glass of mass 0.25kg floats in mercury of density 1.36 × 10⁴kg/m³. What volume of the glass lies under the surface of mercury?
Date posted: May 30, 2019. Answers (1)
- A rectangular block of cross-sectional area 0.08m² is immersed in a liquid of density 1200kg/m³. The top and the lower
surfaces are 80cm and 200cm below...(Solved)
A rectangular block of cross-sectional area 0.08m² is immersed in a liquid of density 1200kg/m³. The top and the lower
surfaces are 80cm and 200cm below the surface of the liquid respectively.
i) What is the downward force on the top of the block?
ii) Calculate the upthrust on the block.
Date posted: May 30, 2019. Answers (1)
- A target of mass 1.05kg hangs from a tree by a long light string. An arrow of mass 100g is shot towards the target with...(Solved)
A target of mass 1.05kg hangs from a tree by a long light string. An arrow of mass 100g is shot towards the target with a
velocity of 10m/s and embeds itself in the target.
Determine:
i) the velocity of the target and the arrow just after collision.
ii) the maximum height reached by the target after the impact.
Date posted: May 30, 2019. Answers (1)