- The figure (a) below shows a distance -time graph of a motion of a body.In the figure (b), sketch the corresponding velocity-time graph for the...(Solved)
The figure (a) below shows a distance -time graph of a motion of a body.In the figure (b), sketch the corresponding velocity-time graph for the same motion.
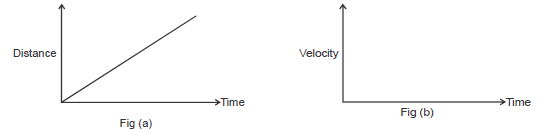
Date posted: May 31, 2019. Answers (1)
- The figure below shows a block diagram of a p-n junction diode.
On the same diagram, show how a cell may be connected so that it...(Solved)
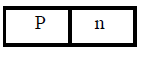
The figure below shows a block diagram of a p-n junction diode.
On the same diagram, show how a cell may be connected so that it is reverse biased.
Date posted: May 31, 2019. Answers (1)
- A bullet is fired from a gun at a velocity of 10m/s. It strikes the tree, perpendicularly and penetrates deeply. If it stops just
as it...(Solved)
A bullet is fired from a gun at a velocity of 10m/s. It strikes the tree, perpendicularly and penetrates deeply. If it stops just
as it emerges through the other side of the tree,
i) Calculate the average retardation if the tree is 2m thick.
ii) Time taken by the bullet in the tree.
Date posted: May 31, 2019. Answers (1)
- The expression below is an equation for a radioactive element P. Element Q and R are the daughter nuclides. P, Q and R are not...(Solved)
The expression below is an equation for a radioactive element P. Element Q and R are the daughter nuclides. P, Q and R are not the actual symbols of any of the elements.
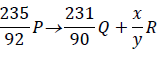
Identify the element R and state two of its characteristics.
Date posted: May 31, 2019. Answers (1)
- A ball is thrown vertically upwards from the ground. It rises up to the highest point and then returns to the ground.Taking
the upward velocity to...(Solved)
A ball is thrown vertically upwards from the ground. It rises up to the highest point and then returns to the ground.Taking
the upward velocity to be positive, sketch the velocity -time graph for the motion.
Date posted: May 31, 2019. Answers (1)
- The mass of the fabric of a large balloon is 100kg. The balloon is inflated with 200cm3 of helium. The balloon is attached to a...(Solved)
The mass of the fabric of a large balloon is 100kg. The balloon is inflated with 200cm3 of helium. The balloon is attached to a cable fixed to the ground as shown.
(Density of air and helium are 1.25kg/m3 and 0.2kg/m3 respectively)
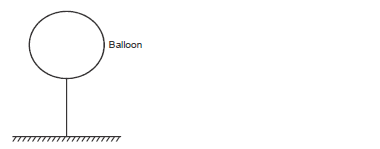
i) Indicate all the forces acting on the system.
ii) If the system is at equilibrium, write an equation relating the three forces in (i) above.
iii) Calculate the upthrust on the balloon.
Date posted: May 31, 2019. Answers (1)
- Explain why most of the x-ray tube is surrounded by lead metal.(Solved)
Explain why most of the x-ray tube is surrounded by lead metal.
Date posted: May 31, 2019. Answers (1)
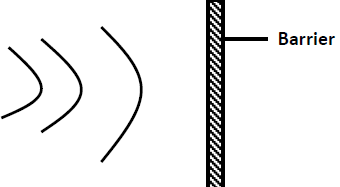
- Figure below shows circular waves approaching a plane barrier in uniform medium.
On the diagram sketch the reflected waves.(Solved)
Figure below shows circular waves approaching a plane barrier in uniform medium.
On the diagram sketch the reflected waves.
Date posted: May 31, 2019. Answers (1)
- A house has two 100w bulbs, two 60w bulbs and one 75w bulb. Determine the cost of having all the bulbs switched on for 60...(Solved)
A house has two 100w bulbs, two 60w bulbs and one 75w bulb. Determine the cost of having all the bulbs switched on for 60 hours, given that the cost of electricity is 50cents per kilowatt hour find the cost.
Date posted: May 31, 2019. Answers (1)
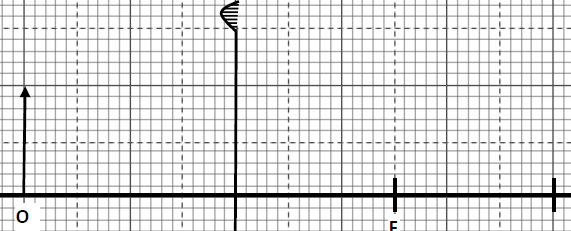
- Figure below shows an object placed in front of a convex mirror.
On the same diagram draw the appropriate rays and locate the image formed.(Solved)
Figure below shows an object placed in front of a convex mirror.
On the same diagram draw the appropriate rays and locate the image formed.
Date posted: May 31, 2019. Answers (1)
- Explain why objects float higher in salty water than in fresh water.(Solved)
Explain why objects float higher in salty water than in fresh water.
Date posted: May 31, 2019. Answers (1)
- A person of mass 50kg is on a swing which has a speed of 10m/s at the lowest point of its motion. The ropes of...(Solved)
A person of mass 50kg is on a swing which has a speed of 10m/s at the lowest point of its motion. The ropes of the swing
are 2.5m long, Find the tension of the ropes. (Take g = 10ms-2)
Date posted: May 31, 2019. Answers (1)
- A motorcycle is travelling at a constant speed of 72km/h around a circular track of radius 150m.
i) Determine its centripetal acceleration.
ii) How long does...(Solved)
A motorcycle is travelling at a constant speed of 72km/h around a circular track of radius 150m.
i) Determine its centripetal acceleration.
ii) How long does the cyclist take to complete one full cycle of the track?
Date posted: May 31, 2019. Answers (1)
- Figure below shows an incident ray normal to the surface BC of a right-angled glass prism ABC. The critical angle of the glass is 420
Complete...(Solved)
Figure below shows an incident ray normal to the surface BC of a right-angled glass prism ABC. The critical angle of the glass is 420
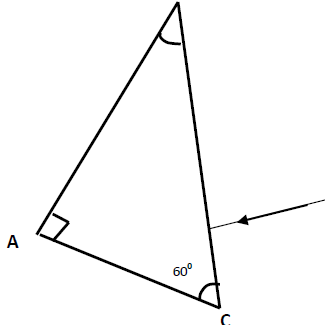
Complete the diagram to show the path of the ray.
Date posted: May 31, 2019. Answers (1)
- A current carrying conductor AB is in a magnetic field as shown in figure below.
a) Indicate the direction of the force F acting on the...(Solved)
A current carrying conductor AB is in a magnetic field as shown in figure below.
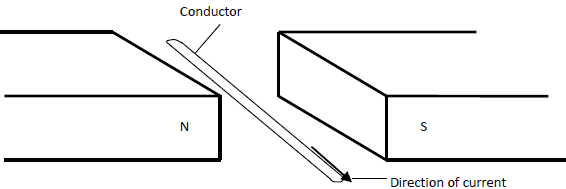
a) Indicate the direction of the force F acting on the conductor.
b) State two factors that determine the direction of the force F.
Date posted: May 31, 2019. Answers (1)
- State two factors on which the linear speed of a body moving in a circular motion depends.(Solved)
State two factors on which the linear speed of a body moving in a circular motion depends.
Date posted: May 31, 2019. Answers (1)
- A battery is rated 100AH. How long will it work if it steadily supplies a current of 2.5A(Solved)
A battery is rated 100AH. How long will it work if it steadily supplies a current of 2.5A
Date posted: May 31, 2019. Answers (1)
- A column of glycerine 8.20m high, a column of sea water 10.08m high, column of mercury 0.76m high and a column of fresh water 10.34m...(Solved)
A column of glycerine 8.20m high, a column of sea water 10.08m high, column of mercury 0.76m high and a column of fresh water 10.34m high exert the same pressure at the bottom of the container.Given that the pressure exerted by a fluid is given by P = h g, arrange these liquid in decreasing order of their densities.
Date posted: May 31, 2019. Answers (1)
- 5 images are formed when two mirrors are inclined at an angle between them. Determine the angle of inclination.(Solved)
5 images are formed when two mirrors are inclined at an angle between them. Determine the angle of inclination.
Date posted: May 31, 2019. Answers (1)
- The figure below shows a metal sphere of mass 2kg moving along a smooth horizontal surface PQ, with a steady speed of
4m/s.
a) Explain why the...(Solved)
The figure below shows a metal sphere of mass 2kg moving along a smooth horizontal surface PQ, with a steady speed of
4m/s.
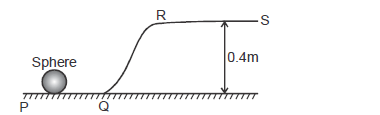
a) Explain why the speed of the sphere decreases as it moves up along QR.
b) If the sphere reaches R with a speed of 1.0m/s, calculate the change in its K.E from Q to R.
Date posted: May 31, 2019. Answers (1)