- Sketch a graph of pressure against temperature on the Celsius scale. On the same axis sketch another graph for a gas of a larger volume.(Solved)
Sketch a graph of pressure against temperature on the Celsius scale. On the same axis sketch another graph for a gas of a larger volume.
Date posted: May 31, 2019. Answers (1)
- A certain mass of hydrogen gas occupies a volume of 1.6m3 at a pressure of 1.5 × 10⁵ Pa and a temperature of 220c.Determine the...(Solved)
A certain mass of hydrogen gas occupies a volume of 1.6m3 at a pressure of 1.5 × 10⁵ Pa and a temperature of 220c.
Determine the volume when the temperature is 00c at a pressure of 0.8×10⁵ Pa.
Date posted: May 31, 2019. Answers (1)
- An electric kettle with a 2.0kw heating element has a heat capacity of 400j/k. 1.0kg of water at 20°C is placed in the kettle. The...(Solved)
An electric kettle with a 2.0kw heating element has a heat capacity of 400j/k. 1.0kg of water at 20°C is placed in the kettle. The kettle is switches on and it is found that 13 minutes later the mass of water in it is 0.5kg. Ignoring heat losses ; calculate
i) Total heat supplied.
ii) Heat used for the kettle.
iii) Heat used to raise temperature of 1kg of water from 20°C to 100°C.
iv) Heat to change water at 100°C to steam at 100°C.
v) The specific latent heat of vaporization of water.
Date posted: May 31, 2019. Answers (1)
- A glass capillary contains enclosed air by a thread of mercury 15cm long when the tube is horizontal, the length of the enclosed air column...(Solved)
A glass capillary contains enclosed air by a thread of mercury 15cm long when the tube is horizontal, the length of the enclosed air column 24cm as shown.
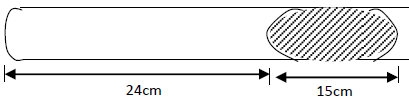
i) What is the length of the enclosed air column when the tube is vertical with the open end uppermost if the atmosphere pressure is 750mmHg?
ii) Explain why the mercury does not run out when the tube is vertical with the closed end uppermost.
Date posted: May 31, 2019. Answers (1)
- A car of mass 800g is initially moving at 25m/s. Calculate the force needed to bring the car to rest over a distance of 20m.(Solved)
A car of mass 800g is initially moving at 25m/s. Calculate the force needed to bring the car to rest over a distance of 20m.
Date posted: May 31, 2019. Answers (1)
- A bob of mass 20kg is suspended using a string of 4m from a support and swings through a vertical height of 0.9m as shown...(Solved)
A bob of mass 20kg is suspended using a string of 4m from a support and swings through a vertical height of 0.9m as shown below:
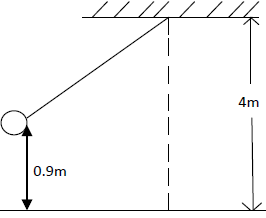
Determine:
i) The potential energy of the body at its position.
ii) Speed of the body when passing through the lowest point.
Date posted: May 31, 2019. Answers (1)
- An electric crane lifts a load of 2000kg through a vertical distance of 3.0m in 6s.
Determine:
i) Work done
ii) Power developed by the crane(Solved)
An electric crane lifts a load of 2000kg through a vertical distance of 3.0m in 6s.
Determine:
i) Work done
ii) Power developed by the crane
Date posted: May 31, 2019. Answers (1)
- A cork enclosing steam in a boiler is held down by the system shown.
If the area of the cork is 15 cm2 and a force...(Solved)
A cork enclosing steam in a boiler is held down by the system shown.
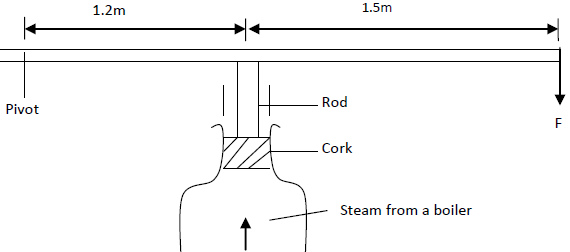
If the area of the cork is 15 cm2 and a force (F) of 500N is needed to keep the cork in place, determine the pressure of the steam in the boiler.
Date posted: May 31, 2019. Answers (1)
- In an experiment to determine the thickness of an oil molecule, an oil drop of volume 3.60 x 10⁻⁶ m3 was observed to form a...(Solved)
In an experiment to determine the thickness of an oil molecule, an oil drop of volume 3.60 x 10⁻⁶ m3 was observed to form a circular patch of diameter 0.016m on the surface of water covered with lycopodium powder
i). Explain why the oil drop forms a circular patch.
ii) Determine the thickness of the oil molecule
Date posted: May 31, 2019. Answers (1)
- The figure below shows a thin thread tied on the surface of water in trough.
When small drops of soapy water was dropped at point P,...(Solved)
The figure below shows a thin thread tied on the surface of water in trough.
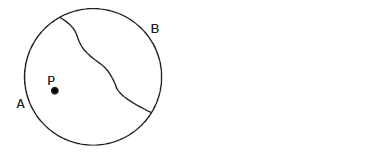
When small drops of soapy water was dropped at point P, the thread curved towards side B. Explain?
Date posted: May 31, 2019. Answers (1)
- The figure below shows a uniform plank AB of length 10m weighing 500N. Two masses measuring 25kg and 60kg are loaded on its ends.
Determine the...(Solved)
The figure below shows a uniform plank AB of length 10m weighing 500N. Two masses measuring 25kg and 60kg are loaded on its ends.
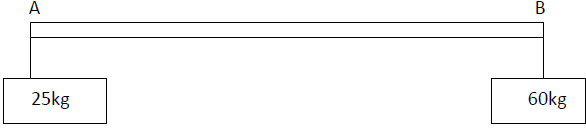
Determine the distance from point A where a support should be placed for the plank to balance horizontally.
Date posted: May 31, 2019. Answers (1)
- A small drop of oil has a volume of 5 × 10⁻⁸m³. When it is put on the surface of some clean water, it forms...(Solved)
A small drop of oil has a volume of 5 × 10⁻⁸m³. When it is put on the surface of some clean water, it forms a circular film of 0.1m² in area; what is the size the a molecule oil.
Date posted: May 31, 2019. Answers (1)
- The diagram below shows a gas cooker thermostat
Briefly explain how the thermostat works(Solved)
The diagram below shows a gas cooker thermostat

Briefly explain how the thermostat works
Date posted: May 31, 2019. Answers (1)
- The distance between the ice point and steam point on a liquid in glass thermometer is 30cm. what temperature is recorded when the mercury thread...(Solved)
The distance between the ice point and steam point on a liquid in glass thermometer is 30cm. what temperature is recorded when the mercury thread is 12cm above the ice point?
Date posted: May 31, 2019. Answers (1)
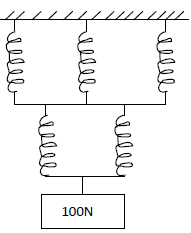
- A single spring stretches by 2.0 cm when supporting a load of 50N. If in the system below the springs are identical and have negligible...(Solved)
A single spring stretches by 2.0 cm when supporting a load of 50N. If in the system below the springs are identical and have negligible weight
Find:
a) The total extension of the system.
b) The total spring constant.
Date posted: May 31, 2019. Answers (1)
- Give one feature that makes parabolic mirrors suitable for use as car head light.(Solved)
Give one feature that makes parabolic mirrors suitable for use as car head light.
Date posted: May 31, 2019. Answers (1)
- The figure below shows a defective eye.
i) State the cause of the defect.
ii) What type of lens is used to correct the defect?(Solved)
The figure below shows a defective eye.
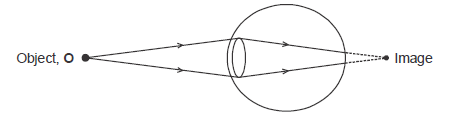
i) State the cause of the defect.
ii) What type of lens is used to correct the defect?
Date posted: May 31, 2019. Answers (1)
- The figure below shows an object placed infront of a thin lens. The focal length of the lens is 10cm. The screen is adjusted
until an...(Solved)
The figure below shows an object placed infront of a thin lens. The focal length of the lens is 10cm. The screen is adjusted
until an image which is magnified 5 times is obtained.
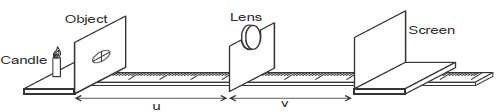
From the information:
a) i) Which type of lens was used in the experiment.
ii) State any other characteristics of the image formed.
iii) Find the value of u.
Date posted: May 31, 2019. Answers (1)
- The figure below shows ultraviolet radiation striking polished zinc plates placed on negatively and positively charged gold
leaf electroscopes respectively.
Explain why the leaf collapses in figure...(Solved)
The figure below shows ultraviolet radiation striking polished zinc plates placed on negatively and positively charged gold
leaf electroscopes respectively.
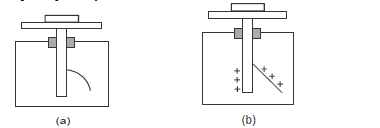
Explain why the leaf collapses in figure (a) but does not collapse in figure (b).
Date posted: May 31, 2019. Answers (1)
- The diagram below shows a micrometer screw gauge used by a student to measure the thickness of a wire. If it has a zero error...(Solved)
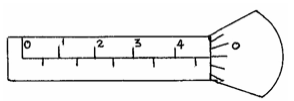
The diagram below shows a micrometer screw gauge used by a student to measure the thickness of a wire. If it has a zero error of 0.06mm, what is the actual thickness of the wire?
Date posted: May 31, 2019. Answers (1)