- The diagram below shows an object placed in front of two mirrors inclined to each other at an angle x
An observer sees five images, determine...(Solved)
The diagram below shows an object placed in front of two mirrors inclined to each other at an angle x

An observer sees five images, determine the value of angle x?
Date posted: May 31, 2019. Answers (1)
- The figure below Shows a source of beta particles and a detector being used to check the thickness of paper in a paper mill.
i) Explain...(Solved)
The figure below Shows a source of beta particles and a detector being used to check the thickness of paper in a paper mill.
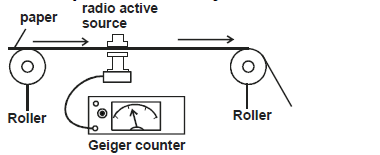
i) Explain how the device works.
ii) Explain why beta particles are used instead of alpha particles or gamma rays.
Date posted: May 31, 2019. Answers (1)
- The diagram below shows waves being diffracted.
What adjustments should be done to obtain the wave form below?(Solved)
The diagram below shows waves being diffracted.
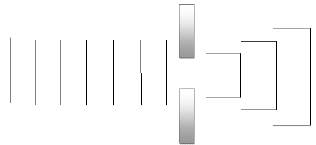
What adjustments should be done to obtain the wave form below?

Date posted: May 31, 2019. Answers (1)
- The figure below shows a section of a house wiring.
i) Name
The circuit labelled X
The terminals A and B.
ii) State the function of P...(Solved)
The figure below shows a section of a house wiring.

i) Name
The circuit labelled X
The terminals A and B.
ii) State the function of P in the circuit.
iii)Give a reason why P is on A but not B.
iv) Explain why earthing is necessary in such a circuit.
Date posted: May 31, 2019. Answers (1)
- Gamma, radio, infrared, x-rays are part of the electromagnetic spectrum.
i) Arrange these radiations in order of increasing energy
ii) State how radio waves are detected(Solved)
Gamma, radio, infrared, x-rays are part of the electromagnetic spectrum.
i) Arrange these radiations in order of increasing energy
ii) State how radio waves are detected
Date posted: May 31, 2019. Answers (1)
- The diagram below shows a current carrying conductor placed in a magnetic field.
i) Show on the diagram the direction of force on the conductor
ii)...(Solved)
The diagram below shows a current carrying conductor placed in a magnetic field.

i) Show on the diagram the direction of force on the conductor
ii) If the current through the conductor is reduced, state and explain what happens to the force in (i) above.
Date posted: May 31, 2019. Answers (1)
- The figure below shows a three pin plug wired by a student and connected to an appliance rated 1000W, 240V.
State two mistakes made by the...(Solved)
The figure below shows a three pin plug wired by a student and connected to an appliance rated 1000W, 240V.

State two mistakes made by the student in the wiring.
Date posted: May 31, 2019. Answers (1)
- A photo sensitive cathode of work function 2.1 eV is illustrated with a radiation of wavelength 4.5× 10⁻⁷. Determine the stopping potential for the cathode....(Solved)
A photo sensitive cathode of work function 2.1 eV is illustrated with a radiation of wavelength 4.5× 10⁻⁷. Determine the stopping potential for the cathode. Speed of light C = 3.0 × 10⁸m/s,1 eV = 1.6 × 10⁻¹⁹j,
h = 6.6 × 10⁻³⁴Js.
Date posted: May 31, 2019. Answers (1)
- The figure shows an apparatus used to investigate photoelectric effect.
i) Name the parts A and B.
ii) State the function of C.(Solved)
The figure shows an apparatus used to investigate photoelectric effect.

i) Name the parts A and B.
ii) State the function of C.
Date posted: May 31, 2019. Answers (1)
- The figure shows a loudspeaker producing sound waves in air.
i) Explain how compression and rarefactions are formed.
iii) The wavelength of the waves produced is...(Solved)
The figure shows a loudspeaker producing sound waves in air.
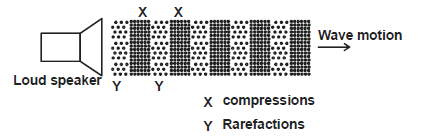
i) Explain how compression and rarefactions are formed.
iii) The wavelength of the waves produced is 0.4m. Determine the frequency of the waves if the speed of sound in air is 330m/s.
Date posted: May 31, 2019. Answers (1)
- A radio transmitter produces waves of frequency 1.5×10⁸Hz. Determine the wavelength of the signal (C = 3.0 × 10⁸m/s).(Solved)
A radio transmitter produces waves of frequency 1.5×10⁸Hz. Determine the wavelength of the signal (C = 3.0 × 10⁸m/s).
Date posted: May 31, 2019. Answers (1)
- The figure below shows a graph of values of reciprocal of frequency and corresponding values of wavelength for waves transmitted in a certain medium.
i) Using...(Solved)
The figure below shows a graph of values of reciprocal of frequency and corresponding values of wavelength for waves transmitted in a certain medium.
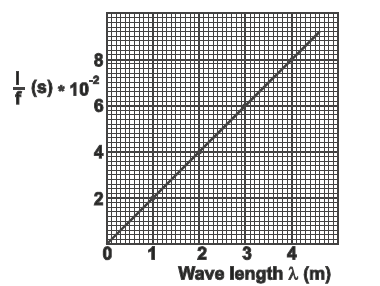
i) Using the wave equation, give the equation of the graph.
ii) Use the graph to determine the velocity of the waves.
Date posted: May 31, 2019. Answers (1)
- The figure below shows a coil connected to a sensitive galvanometer.
When the magnet is suddenly moved towards the coil in the direction shown, the galvanometer...(Solved)
The figure below shows a coil connected to a sensitive galvanometer.
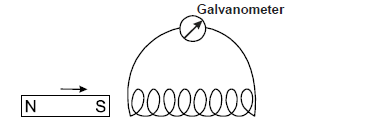
When the magnet is suddenly moved towards the coil in the direction shown, the galvanometer shows a deflection.Explain.
Date posted: May 31, 2019. Answers (1)
- Name an electromagnetic radiation with highest energy photons.(Solved)
Name an electromagnetic radiation with highest energy photons.
Date posted: May 31, 2019. Answers (1)
- An electric heater is rated 1kW, 240V. If the element is connected to 240V mains supply for 10 minutes, determine the amount of heat dissipated.(Solved)
An electric heater is rated 1kW, 240V. If the element is connected to 240V mains supply for 10 minutes, determine the amount of heat dissipated.
Date posted: May 31, 2019. Answers (1)
- The figure below shows a circuit diagram. The emf of the cell is 1.5V. When the switch is closed, the voltmeter reads 1.3V and the
ammeter...(Solved)
The figure below shows a circuit diagram. The emf of the cell is 1.5V. When the switch is closed, the voltmeter reads 1.3V and the
ammeter reads 0.8A.
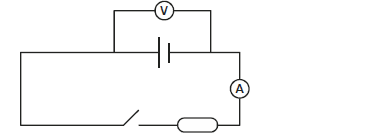
Determine the internal resistance of the cell.
Date posted: May 31, 2019. Answers (1)
- The figure shows a ray of light travelling through a vacuum enters liquid X at an angle of 50°, travels through and emerges in
glass.
Determine angle...(Solved)
The figure shows a ray of light travelling through a vacuum enters liquid X at an angle of 50°, travels through and emerges in
glass.
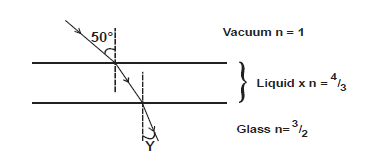
Determine angle Y.
Date posted: May 31, 2019. Answers (1)
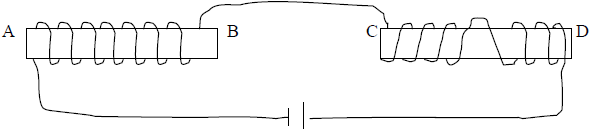
- Identify the magnetic poles A, B, C and D in the diagram below.(Solved)
Identify the magnetic poles A, B, C and D in the diagram below.
Date posted: May 31, 2019. Answers (1)
- The figure below shows two parallel light rays incident on a concave mirror.
Sketch on the same diagram the path of the rays after striking the...(Solved)
The figure below shows two parallel light rays incident on a concave mirror.
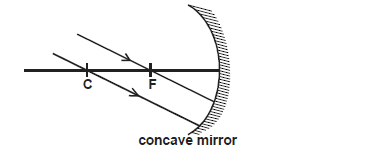
Sketch on the same diagram the path of the rays after striking the mirror and show the image.
Date posted: May 31, 2019. Answers (1)
- A person claps his hands at approximately 0.5s intervals in front of a wall 90m away. He notices that each echo produced by the wall...(Solved)
A person claps his hands at approximately 0.5s intervals in front of a wall 90m away. He notices that each echo produced by the wall coincides with the next clap.
i) Calculate the approximate speed of sound
ii) If the results obtained above were used as a basis for an experimental method to determine the speed of sound, what procedure should be adopted to obtain high accuracy in the timing part of the experiment?
Date posted: May 31, 2019. Answers (1)