
(i) 29.3% (29 - 29.5%) 29%
(ii) 4.75%/4.8%/4.9%
(4.75% - 4.9%)
(iii) Describe the trend of the value of coffee exports from years 1999 to 2003.
• The value was generally declining over the five year period.
• The value was highest in 1999.
• The decline between 1999 and 2000 was minimal/gradual.
• The highest drop was between 2000 and 2001
• There was a minimal drop between 2002 and 2003.
• The decline between 2001 and 2002 was minimal/gradual.
• The value was lowest in 2003.
(iv) Explain three factors which may have led to the increased export earnings
from horticultural produce in Kenya between years 1999 and 2003.
• Improved technology which leads to advanced crop husbandry/increase the volume of fresh horticultural products.
• Aggressive promotion of trade abroad leading to a wide/ready market in foreign countries.
• Improved ways of packaging have made the produce more competitive/ attractive,
• Improved infrastructure/air/road transport have helped in the quick means of transportation of fresh produce to the market.
• The declining benefits from traditional agricultural exports leading to the expansion of the areas under horticultural crops.
• The government has encouraged the formation of organizations that are assisting horticultural farmers.
(v) Give three advantages of using simple line graphs to represent data.
• Give clear visual impression.
• Easy to construct.
• Easy to interpret.
• Can be used to represent a wide variety of variables.
• Appropriate for comparison.
Kavungya answered the question on June 7, 2019 at 08:12
- The table below shows petroleum production in thousand barrels per day for countries in the Middle East in April 2006. Use it to answer questions...(Solved)
The table below shows petroleum production in thousand barrels per day for countries in the Middle East in April 2006. Use it to answer questions below.
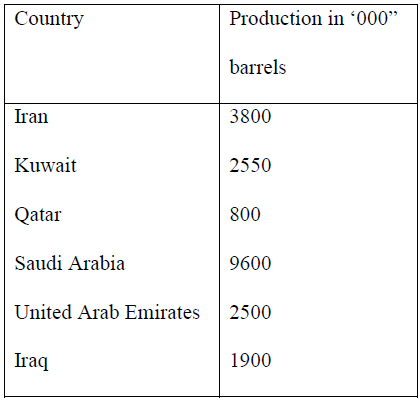
(i) What is the difference in production between the highest and the
lowest producer
(ii) What is the total amount of petroleum produced in April 2006 in
the region?
Date posted: June 7, 2019. Answers (1)
- Why does sea breeze flow at night time?(Solved)
Why does sea breeze flow at night time?
Date posted: June 7, 2019. Answers (1)
- A mass of air at 15°C can hold 20gm/cm3 of moisture. The same air at the same temperature has 6gm/cm3 of moisture. What is its...(Solved)
A mass of air at 15°C can hold 20gm/cm3 of moisture. The same air at the same temperature has 6gm/cm3 of moisture. What is its relative humidity?
Date posted: June 7, 2019. Answers (1)
- Use the data below to answer questions that follow.
(i) Calculate mean annual temperature
(ii) Calculate annual rainfall
(iii) Calculate annual range of temperature.
(iv) Calculate the mean annual...(Solved)
Use the data below to answer questions that follow.
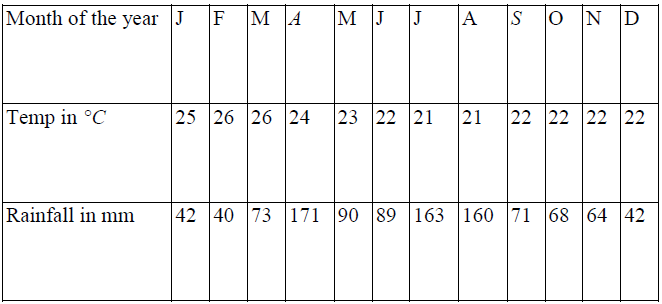
(i) Calculate mean annual temperature
(ii) Calculate annual rainfall
(iii) Calculate annual range of temperature.
(iv) Calculate the mean annual rainfall
(v) Which is the wettest month?
Date posted: June 7, 2019. Answers (1)
- List four problems of weather forecasting.(Solved)
List four problems of weather forecasting.
Date posted: June 7, 2019. Answers (1)
- Briefly write down two problems associated with convectional rainfall(Solved)
Briefly write down two problems associated with convectional rainfall
Date posted: June 7, 2019. Answers (1)
- Identify and explain the formation of the type of rainfall found in the Lake Region of Kenya.(Solved)
Identify and explain the formation of the type of rainfall found in the Lake Region of Kenya.
Date posted: June 7, 2019. Answers (1)
- Describe how you would use the following apparatus during a field study.
Raingauge, maximum and minimum thermometers.(Solved)
Describe how you would use the following apparatus during a field study.
Raingauge, maximum and minimum thermometers.
Date posted: June 7, 2019. Answers (1)
- Define the following terms:
(i) Climate
(ii) Relative humidity
(iii) Weather forecasting
(iv) Absolute humidity
(v) Weather lore(Solved)
Define the following terms:
(i) Climate
(ii) Relative humidity
(iii) Weather forecasting
(iv) Absolute humidity
(v) Weather lore
Date posted: June 7, 2019. Answers (1)
- Give three precautions to be taken when citing a weather station.(Solved)
Give three precautions to be taken when citing a weather station.
Date posted: June 7, 2019. Answers (1)
- State the difference between radiation fog and advection fog.(Solved)
State the difference between radiation fog and advection fog.
Date posted: June 7, 2019. Answers (1)
- Describe a suitable site where you would locate a weather station in your School(Solved)
Describe a suitable site where you would locate a weather station in your School
Date posted: June 7, 2019. Answers (1)
- If the local time in Nairobi on longitude 37°E time is 10 p.m. What will the time be at Buchanan Liberia on longitude 10°W.?
(a)...(Solved)
If the local time in Nairobi on longitude 37°E time is 10 p.m. What will the time be at Buchanan Liberia on longitude 10°W.?
(a) What is the effect of International Date Line on crossing the line?
(b) What is the angle of inclination of the earth axis from its orbit?
(c) Give four proofs that the earth is spherical in shape.
Date posted: June 7, 2019. Answers (1)
- Explain the reason for bulging of the earth.(Solved)
Explain the reason for bulging of the earth.
Date posted: June 7, 2019. Answers (1)
- Planet ... 1... is seventh planet from the sun and is greenish in colour. Planet ...2... takes shortest time to revolve round the sun about...(Solved)
Planet ... 1... is seventh planet from the sun and is greenish in colour. Planet ...2... takes shortest time to revolve round the sun about 88 earth day. Planet ...3... and ...4... are referred to as twin planets. Planet ...5... takes about 11.86 earth years to revolve round the sun. All the planets have satellite orbiting round them except planet ...6... and ...7...
Date posted: June 7, 2019. Answers (1)
- Differentiate between hydrosphere and atmosphere.(Solved)
Differentiate between hydrosphere and atmosphere.
Date posted: June 7, 2019. Answers (1)
- Fill in the table from (a) - (f)(Solved)
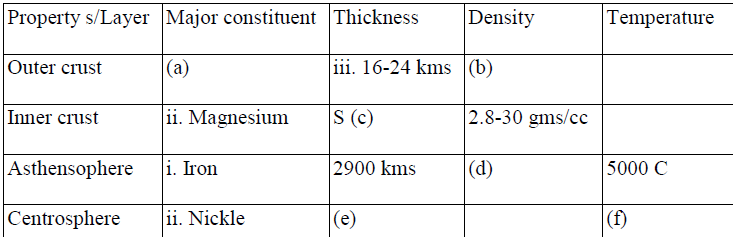
Fill in the table from (a) - (f)
Date posted: June 7, 2019. Answers (1)
- The earth is inclined to the ecliptic plane at an angle of..... and the axis is also inclined at an angle ..... to perpendicular line.(Solved)
The earth is inclined to the ecliptic plane at an angle of..... and the axis is also inclined at an angle ..... to perpendicular line.
Date posted: June 7, 2019. Answers (1)
- State characteristics of summer solstice.(Solved)
State characteristics of summer solstice.
Date posted: June 7, 2019. Answers (1)
- Define equinox.(Solved)
Define equinox.
Date posted: June 7, 2019. Answers (1)