• Prominent values stick out well
• Bars are appealing to the eye
• Easy to draw, read and interpret the data represented
Kavungya answered the question on June 7, 2019 at 08:25
-
Name two types of graphs that you have learned about.
(Solved)
Name two types of graphs that you have learned about.
Date posted:
June 7, 2019
.
Answers (1)
-
Name two main methods used in analyzing statistical data.
(Solved)
Name two main methods used in analyzing statistical data.
Date posted:
June 7, 2019
.
Answers (1)
-
What is sampling?
(Solved)
What is sampling?
Date posted:
June 7, 2019
.
Answers (1)
-
Differentiate between discrete data and continuous data giving relevant examples.
(Solved)
Differentiate between discrete data and continuous data giving relevant examples.
Date posted:
June 7, 2019
.
Answers (1)
-
What factors must be considered in selecting methods of data collection?
(Solved)
What factors must be considered in selecting methods of data collection?
Date posted:
June 7, 2019
.
Answers (1)
-
State two types of statistical data.
(Solved)
State two types of statistical data.
Date posted:
June 7, 2019
.
Answers (1)
-
State four reasons why Kenya’s agricultural export earnings are generally low
(Solved)
State four reasons why Kenya’s agricultural export earnings are generally low
Date posted:
June 7, 2019
.
Answers (1)
-
The graph below shows percentage value of some export commodities from Kenya between 1999 and 2003. Use it to answer questions below.
(i) What was the...
(Solved)
The graph below shows percentage value of some export commodities from Kenya between 1999 and 2003. Use it to answer questions below.
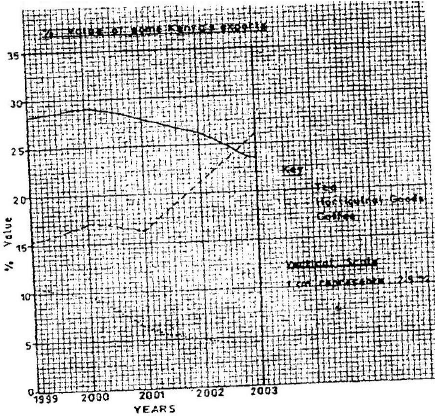
(i) What was the percentage value of the tea exported in the year
2000?
(ii) What was the difference in the percentage values of the
horticultural products and coffee exports in 1999?
(iii) Describe the trend of the value of coffee exports from 1999 to
2003
(iv) Explain three factors which may have led to the increased export earnings from horticultural produce in Kenya between years 1999 and 2003
(v) Give three advantages of using simple line graphs to represent
data.
Date posted:
June 7, 2019
.
Answers (1)
-
The table below shows petroleum production in thousand barrels per day for countries in the Middle East in April 2006. Use it to answer questions...
(Solved)
The table below shows petroleum production in thousand barrels per day for countries in the Middle East in April 2006. Use it to answer questions below.
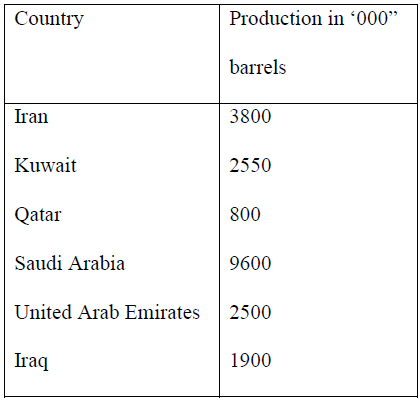
(i) What is the difference in production between the highest and the
lowest producer
(ii) What is the total amount of petroleum produced in April 2006 in
the region?
Date posted:
June 7, 2019
.
Answers (1)
-
Why does sea breeze flow at night time?
(Solved)
Why does sea breeze flow at night time?
Date posted:
June 7, 2019
.
Answers (1)
-
A mass of air at 15°C can hold 20gm/cm3 of moisture. The same air at the same temperature has 6gm/cm3 of moisture. What is its...
(Solved)
A mass of air at 15°C can hold 20gm/cm3 of moisture. The same air at the same temperature has 6gm/cm3 of moisture. What is its relative humidity?
Date posted:
June 7, 2019
.
Answers (1)
-
Use the data below to answer questions that follow.
(i) Calculate mean annual temperature
(ii) Calculate annual rainfall
(iii) Calculate annual range of temperature.
(iv) Calculate the mean annual...
(Solved)
Use the data below to answer questions that follow.
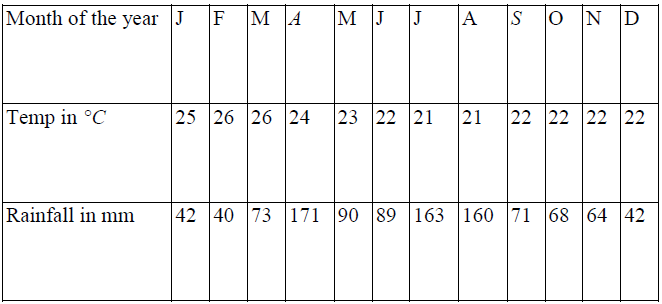
(i) Calculate mean annual temperature
(ii) Calculate annual rainfall
(iii) Calculate annual range of temperature.
(iv) Calculate the mean annual rainfall
(v) Which is the wettest month?
Date posted:
June 7, 2019
.
Answers (1)
-
List four problems of weather forecasting.
(Solved)
List four problems of weather forecasting.
Date posted:
June 7, 2019
.
Answers (1)
-
Briefly write down two problems associated with convectional rainfall
(Solved)
Briefly write down two problems associated with convectional rainfall
Date posted:
June 7, 2019
.
Answers (1)
-
Identify and explain the formation of the type of rainfall found in the Lake Region of Kenya.
(Solved)
Identify and explain the formation of the type of rainfall found in the Lake Region of Kenya.
Date posted:
June 7, 2019
.
Answers (1)
-
Describe how you would use the following apparatus during a field study.
Raingauge, maximum and minimum thermometers.
(Solved)
Describe how you would use the following apparatus during a field study.
Raingauge, maximum and minimum thermometers.
Date posted:
June 7, 2019
.
Answers (1)
-
Define the following terms:
(i) Climate
(ii) Relative humidity
(iii) Weather forecasting
(iv) Absolute humidity
(v) Weather lore
(Solved)
Define the following terms:
(i) Climate
(ii) Relative humidity
(iii) Weather forecasting
(iv) Absolute humidity
(v) Weather lore
Date posted:
June 7, 2019
.
Answers (1)
-
Give three precautions to be taken when citing a weather station.
(Solved)
Give three precautions to be taken when citing a weather station.
Date posted:
June 7, 2019
.
Answers (1)
-
State the difference between radiation fog and advection fog.
(Solved)
State the difference between radiation fog and advection fog.
Date posted:
June 7, 2019
.
Answers (1)
-
Describe a suitable site where you would locate a weather station in your School
(Solved)
Describe a suitable site where you would locate a weather station in your School
Date posted:
June 7, 2019
.
Answers (1)