The correct answer is A [2: 00 p.m and 7: 00 p. m]
- The change in time is bigger and the change of distance is very small.
Wilfykil answered the question on July 29, 2019 at 13:07
- The table below shows the type of vehicles and the number of people transported, in each type of a vehicle, to a rally on Saturday...(Solved)
The table below shows the type of vehicles and the number of people transported, in each type of a vehicle, to a rally on Saturday and Sunday.
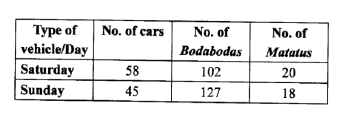
Each car carried 4 people, each bodaboda carried 2 people and each matatu carried 14 people. How many people were transported to the rally by the end of the second day?
A. 40
B. 370
C. 716
D. 1402
Date posted: July 29, 2019. Answers (1)
- In the figure below, QT bisects angle PQR. Angle RPQ = 44°, line PQ = PR and QRS is a straight line. (Solved)
In the figure below, QT bisects angle PQR. Angle RPQ = 44°, line PQ = PR and QRS is a straight line.
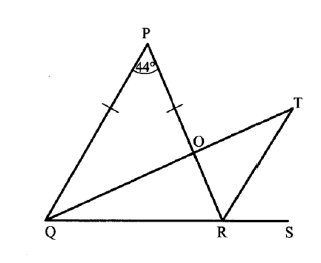
What is the size of angle QOP?
A. 34°
B. 68°
C. 78°
D. 102°
Date posted: July 29, 2019. Answers (1)
- Kuria takes 2 h 15 min to cycle from home to the market at an average speed of 8km/h. He cycles from the market back...(Solved)
Kuria takes 2 h 15 min to cycle from home to the market at an average speed of 8km/h. He cycles from the market back home at an average speed of 12km/h. How much time does Kuria take to cycle from home to the market and back?
A. 
B. 
C. 
D. 
Date posted: July 29, 2019. Answers (1)
- The level of fuel in a container decreased by 2% each hour. If the capacity of fuel in the container was 1600 litres, what was...(Solved)
The level of fuel in a container decreased by 2% each hour. If the capacity of fuel in the container was 1600 litres, what was the capacity after 2 hours?
A. 1664.641
B. 15681
C. 1536.641
D. 15361
Date posted: July 29, 2019. Answers (1)
- Chebet bought a sofa set for sh 64,000. The sofa set was later sold, making a 20% loss. For how much was the sofa set...(Solved)
Chebet bought a sofa set for sh 64,000. The sofa set was later sold, making a 20% loss. For how much was the sofa set sold?
A. sh 80000
B. sh 76800
C. sh 51200
D. sh 12800
Date posted: July 29, 2019. Answers (1)
- Asha made a profit of sh 18000 from her trade. (Solved)
Asha made a profit of sh 18000 from her trade. She spent  of the profit on food and
  of the remainder on paying bills and fuel. She saved the rest. How much money did she save?
A. sh 13200
B. sh 7200
C. sh 6000
D. sh 4800
Date posted: July 29, 2019. Answers (1)
- Karai is x years old and two years older than his wife. In ten years’ time he will be 3 times as old as his...(Solved)
Karai is x years old and two years older than his wife. In ten years’ time he will be 3 times as old as his daughter. What will be their total age then?
Date posted: July 29, 2019. Answers (1)
- What is the simplest form of the ratio(Solved)
What is the simplest form of the ratio 
A. 3:5
B. 5:3
C. 6:10
D. 21:10
Date posted: July 29, 2019. Answers (1)
- A rectangular water tank whose base measures 5.2m by 4m has a height of 3 metres. The tank is three quarter full. How many litres...(Solved)
A rectangular water tank whose base measures 5.2m by 4m has a height of 3 metres. The tank is three quarter full. How many litres of water are needed to fill the tank?
A. 62400
B. 46800
C. 15600
D. 15.6
Date posted: July 29, 2019. Answers (1)
- The figure below represents an incomplete stack made of blocks.(Solved)
The figure below represents an incomplete stack made of blocks.

How many blocks are required to complete the stack?
A. 60
B. 48
C. 30
D. 18
Date posted: July 29, 2019. Answers (1)
- What is the place value of digit 6 in 52.25 ÷ 4?(Solved)
What is the place value of digit 6 in 52.25 ÷ 4?
A. tenths
B. hundredths
C. thousandths
D. ten thousandths
Date posted: July 29, 2019. Answers (1)
- In the figure below line XY is parallel to line QR. Line XY = line PY and angle QRP = 74°.(Solved)
In the figure below line XY is parallel to line QR. Line XY = line PY and angle QRP = 74°.
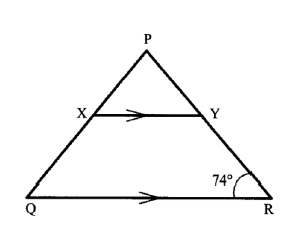
What is the size of angle RQP?
A. 37°
B. 53°
C. 106°
D. 127°
Date posted: July 29, 2019. Answers (1)
- The mean mark of the scores obtained by ten pupils in a test was l2.(Solved)
The mean mark of the scores obtained by ten pupils in a test was l2. The marks obtained by eight of the pupils were:
l3, 11, 10, 9, 10, 18, 11, l0
If the other two pupils obtained equal marks, what was the median mark in the test?
A. 10
B. 10.5
C. 11
D. 14
Date posted: July 29, 2019. Answers (1)
- How much did he have at the end of three years, altogether?(Solved)
Lorina deposited sh 50,000 at a financial institution that paid Simple Interest at the rate of  p.a. How much did he have at the end of three years, altogether?
A. sh 16250
B. sh 57500
C. sh 53750
D. sh 3750
Date posted: July 29, 2019. Answers (1)
- The cash price of a T.V. set was sh 22000. Maria bought the T.V. set on hire purchase terms.(Solved)
The cash price of a T.V. set was sh 22000. Maria bought the T.V. set on hire purchase terms. She was allowed to pay a deposit equal to 40% of the cash price and eight equal monthly installments of sh 2800. How much more money did she pay than the cash price?
A. sh 8800
B. sh 9200
C. sh 22400
D. sh 31200
Date posted: July 29, 2019. Answers (1)
- Simplify the question below(Solved)
What is 
Date posted: July 29, 2019. Answers (1)
- What is the product of 2.645 and 5.06 in 2 decimal places?(Solved)
What is the product of 2.645 and 5.06 in 2 decimal places?
A. 13.41
B. 13.43
C. 13.38
D. 13.46
Date posted: July 29, 2019. Answers (1)
- In an election 150 people participated in voting.(Solved)
In an election 150 people participated in voting. Out of these, 0.14 voted for candidate P, 0.2 voted for candidate Q, while two thirds of the remaining people voted for candidate R. The rest cast votes that were declared invalid. How many people cast invalid votes?
A. 21
B. 30
C. 33
D. 66
Date posted: July 29, 2019. Answers (1)
- Natasha is paid a basic salary of sh 12000 in a month as a sales agent. She is also paid a 5% commission on goods...(Solved)
Natasha is paid a basic salary of sh 12000 in a month as a sales agent. She is also paid a 5% commission on goods sold above sh 20000. In a certain month, she sold goods worth sh 120000. How much money did she earn, in total, that month?
A. sh 5,000
B. sh 17,000
C. sh 18,000
D. sh 19,000
Date posted: July 29, 2019. Answers (1)
- What is the difference between the next two numbers in the pattern: 4, 9, 25, 49,121,...,...,?(Solved)
What is the difference between the next two numbers in the pattern: 4, 9, 25, 49,121,...,...,?
A. 120
B. 169
C. 289
D. 458
Date posted: July 29, 2019. Answers (1)