- Give three conditions necessary for formation of coral reefs(Solved)
Give three conditions necessary for formation of coral reefs
Date posted: August 9, 2019. Answers (1)
- Define the term sea.(Solved)
Define the term sea.
Date posted: August 9, 2019. Answers (1)
- Students from Itiero Girls High School intend to carry out a field study of a fault block near their school.(Solved)
Students from Itiero Girls High School intend to carry out a field study of a fault block near their school.
(i) List any three objectives for their study
(ii) List any two secondary sources of information that they would use to collect data
Date posted: August 9, 2019. Answers (1)
- Students from Gawa Secondary are planning to carry out a field study on sources and uses of water around their school.
(Solved)
Students from Gawa Secondary are planning to carry out a field study on sources and uses of water around their school.
(i) Identify any three activities they would carry out before the actual field study.
(ii) Give four reasons why it is important to have a working schedule.
(iii) State any three methods they would use to record data.
Date posted: August 8, 2019. Answers (1)
- What is climate change.(Solved)
What is climate change.
Date posted: August 8, 2019. Answers (1)
- State any three factors that influence climate, along the Coast of Kenya.(Solved)
State any three factors that influence climate, along the Coast of Kenya.
Date posted: August 8, 2019. Answers (1)
- Describe the factors that influence temperature.(Solved)
Describe the factors that influence temperature.
Date posted: August 8, 2019. Answers (1)
- Use the diagram below to answer question a(i) and (ii)
(Solved)
Use the diagram below to answer question a(i) and (ii)
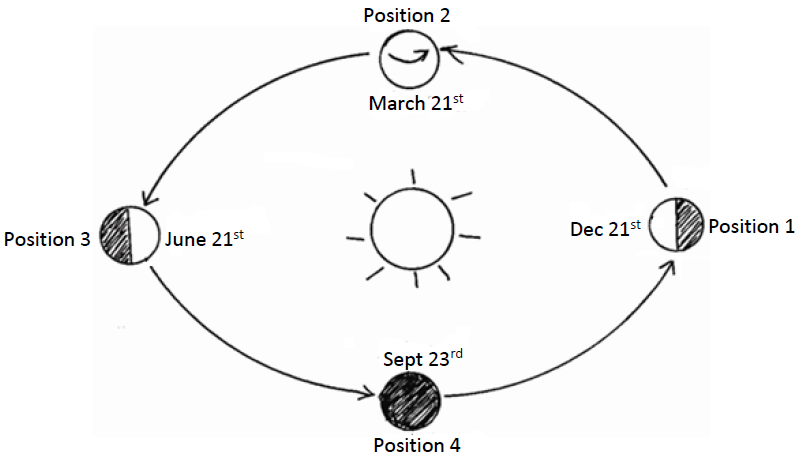
(i) What season does the Northern Hemisphere experience at position I?
(ii) Which two positions does the earth experience equinoxes?
Date posted: August 8, 2019. Answers (1)
- Your class intends to carry out a field study on the features along the coast Kenya.
(Solved)
Your class intends to carry out a field study on the features along the coast Kenya.
(i) Why would they carry a reconnaissance study
(ii) Give three disadvantages of using observation to collect data
Date posted: August 8, 2019. Answers (1)
- Explain four negative effects of glaciated lowland features(Solved)
Explain four negative effects of glaciated lowland features
Date posted: August 8, 2019. Answers (1)
- The diagram below shows a glaciated feature found in lowland. Study it and answer that question that follow.(Solved)
The diagram below shows a glaciated feature found in lowland. Study it and answer that question that follow.
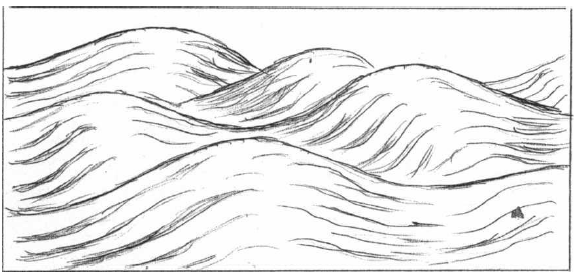
(i) Identify the feature above
(ii) Apart from abrasion process identify the other glacial process involved in the formation of the above feature
(iii) Describe four characteristics of the feature shown on the diagram.
(iv) Name one erosional lowland glaciated feature
Date posted: August 8, 2019. Answers (1)
- The map below shows the distribution of world climatic types. Study it and answer the questions that follow.(Solved)
The map below shows the distribution of world climatic types. Study it and answer the questions that follow.
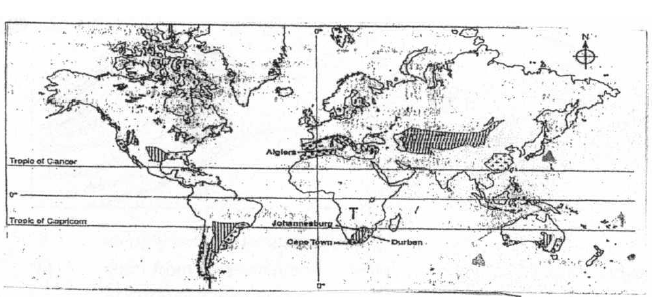
(i) Name the climatic type labeled T
(ii) By which other term is this climatic type T is known
(iii) Describe seven characteristics climatic type T
(iv) Name any four countries where this type of climate T is found
Date posted: August 7, 2019. Answers (1)
- your class intends to carry out a field study on soils within the school environment(i) State any two methods of data collection you will useii)...(Solved)
Your class intends to carry out a field study on soils within the school environment
(i) State any two methods of data collection you will use
ii) List any three methods of data recording you are to use.
Date posted: August 7, 2019. Answers (1)
- State any three factors that influence the development of drainage pattern(Solved)
State any three factors that influence the development of drainage pattern
Date posted: August 7, 2019. Answers (1)
- The local time of town A 400E is 12 noon.
What will be the local time of B 300E?(Solved)
The local time of town A 400E is 12 noon.
What will be the local time of B 300E?
Date posted: August 7, 2019. Answers (1)
- Suppose you were to carry out a field study of a glaciated highland:
(i) State two disadvantages of using observation as a method of data collection.
...(Solved)
Suppose you were to carry out a field study of a glaciated highland:
(i) State two disadvantages of using observation as a method of data collection.
(ii) State two problems you are likely to encounter.
(iii) Suggest two economic activities you would recommend to the Government in this area.
Date posted: August 7, 2019. Answers (1)
- Study the diagram below which shows a glaciated highland and answer questions that follow(Solved)
Study the diagram below which shows a glaciated highland and answer questions (i) and (ii)
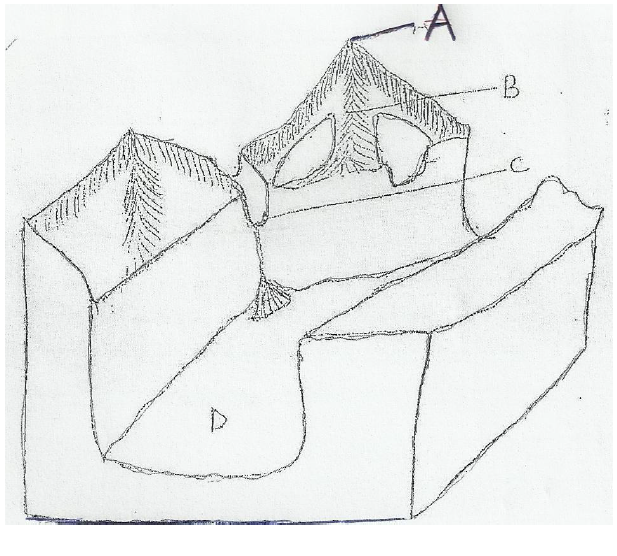
i) Name the features marked A, B, C and D.
ii) Describe how features A and D were formed.
Date posted: August 7, 2019. Answers (1)
- Explain three importance of underground water.(Solved)
Explain three importance of underground water.
Date posted: August 7, 2019. Answers (1)
- Study the table below and answer the question.(Solved)
Study the table below and answer the question.
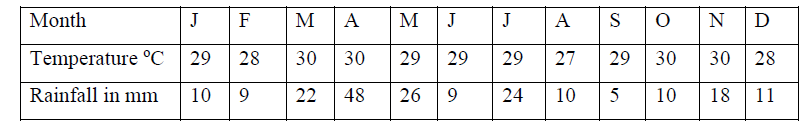
(i) Calculate the mean annual rainfall.
(ii) What is the annual range of temperature?
Date posted: August 7, 2019. Answers (1)
- Name two ice capped mountains in Africa.(Solved)
Name two ice capped mountains in Africa.
Date posted: August 7, 2019. Answers (1)