- The figure below shows a rhombus PQRS with PQ = 9cm and angle SPQ=600. SXQ is a circular arc;centre P.(Solved)
The figure below shows a rhombus PQRS with PQ = 9cm and angle SPQ=600. SXQ is a circular arc;
centre P.
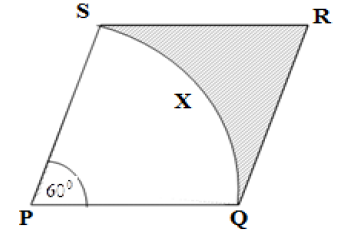
Calculate the area of the shaded region correct to two decimal places. (Take pi=22/7 )
Date posted: August 9, 2019. Answers (1)
- Annette has some money in two denominations only. Fifty shilling notes and twenty shilling coins.
She has three times as many fifty shilling notes as twenty...(Solved)
Annette has some money in two denominations only. Fifty shilling notes and twenty shilling coins.
She has three times as many fifty shilling notes as twenty shilling coins. If altogether she has sh. 3400,
find the number of fifty shilling notes and 20 shilling coins.
Date posted: August 9, 2019. Answers (1)
- A key cutting factory starts cutting keys at the rate of 500 per hour. The rate of production reduces by
10% every 2 hours. Calculate the...(Solved)
A key cutting factory starts cutting keys at the rate of 500 per hour. The rate of production reduces by
10% every 2 hours. Calculate the numbers of keys cut in the first 6 hours.
Date posted: August 9, 2019. Answers (1)
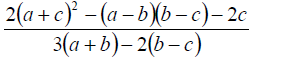
- Given that a =-2, b = -1 and c=3, evaluate(Solved)
Given that a =-2, b = -1 and c=3, evaluate
Date posted: August 9, 2019. Answers (1)
- Plot all the triangles in the grid provided and determine(Solved)
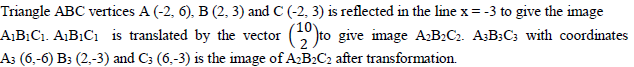
Plot all the triangles in the grid provided and determine
(i) The transformation that maps A2B2C2 onto A3B3C3
(ii) The simple transformation that maps ABC onto A3B3C3
Date posted: August 9, 2019. Answers (1)
- Find the surface area and volume of the frustrum given below(Solved)
Find
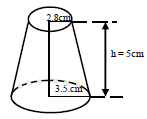
(a) The surface area of the frustrum
(b) The volume of frustrum shown.
Date posted: August 9, 2019. Answers (1)
- The table below shows the length of 40 seedlings.(Solved)
The table below shows the length of 40 seedlings.
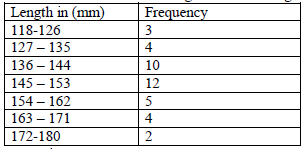
Determine
(a) (i) The modal class
(ii) The median class
(b) (i) The mean of the seedlings
(ii) The median of the seedlings
Date posted: August 9, 2019. Answers (1)
- A business lady bought 100 quails and 80 rabbits for Sh. 25,600.(Solved)
A business lady bought 100 quails and 80 rabbits for Sh. 25,600. If she had bought twice as many rabbits and half as many quails she would have paid Sh. 7,400 less. She sold each quail at a profit of 10% and each rabbit at a profit of 20%.
(a) Form two equations to show how much she bought the quails and the rabbits
(b) Find the cost of each
(c) Calculate the profit she made from the sale of the 100 quails and 80 rabbits
(d) What percentage profit did she make from the sale of the 100 quails and 80 rabbits
Date posted: August 9, 2019. Answers (1)
- The straight line through the points D (6, 3) and E (3, -2) meets the y-axis at the point F. Determine
the coordinates of F.(Solved)
The straight line through the points D (6, 3) and E (3, -2) meets the y-axis at the point F. Determine
the coordinates of F.
Date posted: August 9, 2019. Answers (1)
- Solve the equation 3x2 +4x=2 giving the roots correct to two decimal places(Solved)
Solve the equation 3x2 +4x=2 giving the roots correct to two decimal places
Date posted: August 9, 2019. Answers (1)
- An expedition has 5 sections AB, BC, CD, DE and EA. B is 200m on a bearing of 0500 from A. C is 500m from...(Solved)
An expedition has 5 sections AB, BC, CD, DE and EA. B is 200m on a bearing of 0500 from A. C is 500m from B. The bearing of B from C is 3000. D is 400m on a bearing 2300 from C. E is 250m on a bearing 0250 from D.
(a) Sketch the route
(b) Use the scale of 1cm to 50m to draw the accurate diagram representing the route.
(c) Use your diagram to determine
(i) Distance in metres of A from E
(ii) Bearing of E from A
Date posted: August 9, 2019. Answers (1)
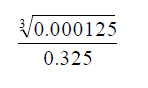
- Use tables of reciprocal only to evaluate,hence evaluate ;(Solved)
Use tables of reciprocal only to evaluate  ,hence evaluate ;
Date posted: August 9, 2019. Answers (1)
- In the figure below, ABCD is a trapezium, AB is parallel to DC, diagonals AC and DB intersect at X and DC = 2AB. AB...(Solved)
In the figure below, ABCD is a trapezium, AB is parallel to DC, diagonals AC and DB intersect at X and DC = 2AB. AB = a, DA = d,AX = KAC and DX = h DB, where h and K are constants.
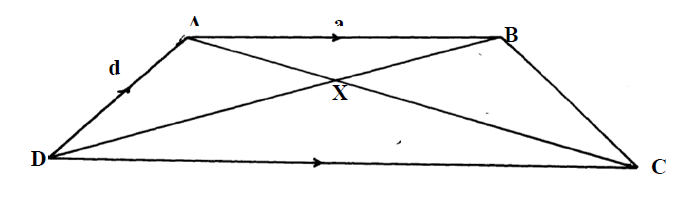
(a) Find in terms of a and d
i) BC
ii) AX
iii) DX
b) Determine the values of h and k
Date posted: August 9, 2019. Answers (1)
- A carpenter constructed a closed wooden box with internal measurements 1.5metres long, 0.8 metres wide and 0.4 metres high. The wood used in constructing the...(Solved)
A carpenter constructed a closed wooden box with internal measurements 1.5metres long, 0.8 metres wide and 0.4 metres high. The wood used in constructing the box was 1.0 cm thick and had a density of 0.6g/cm3.
a) Determine
i) Volume in cm3, of the wood used in constructing the box .
ii) mass of the box, in kilograms, correct to 1 decimal place.
b) Identical cylindrical tin of diameter 10cm, height 20cm with a mass of 120g each were packed in the box.
Calculate the:
i) Maximum number of tins that were packed.
ii) total mass of the box with the tins.
Date posted: August 9, 2019. Answers (1)
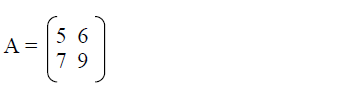
- a) Find A-1, the inverse of matrix is as shown below.
b) Okelo bought 5 physics books and six mathematics books for a total of Ksh.....(Solved)
a) Find A-1, the inverse of matrix is as shown below
b) Okelo bought 5 physics books and six mathematics books for a total of Ksh.. 2440. Ali bought 7 physics books and 9 mathematics books for a total cost of ksh. 3560.
i) Form a matrix equation to represent the above information.
ii) Use matrix methods to find the price of a physics book and that of a mathematics book.
(c) A school bought 36 physics books and 50 mathematics books. A discount of 5 % was allowed
on each physics book whereas discount of 8% was allowed on each mathematics book.
Calculate the percentage discount on the cost of all the books bought.
Date posted: August 9, 2019. Answers (1)
- Given that Cos (x – 20)0 = Sin (2x + 32)0 and x is an acute angle, Find tan (x – 4)0(Solved)
Given that Cos (x – 20)0 = Sin (2x + 32)0 and x is an acute angle, Find tan (x – 4)0
Date posted: August 9, 2019. Answers (1)
- In the figure below PQRS is a trapezium with QR parallel to PS. QR = 6cm, RS = 4cm, QS = 9cm and PS =...(Solved)
In the figure below PQRS is a trapezium with QR parallel to PS. QR = 6cm, RS = 4cm, QS = 9cm and PS = 10cm.
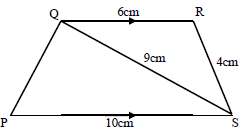
Calculate
(a) The size of angle SQR
(b) The area of triangle PQS
Date posted: August 9, 2019. Answers (1)
- In a uniformly accelerated motion the distance, s metres, travelled in time t seconds varies partly as the square of the time. When the distance...(Solved)
In a uniformly accelerated motion the distance, s metres, travelled in time t seconds varies partly as the square of the time. When the distance traveled is 80m and when the time is 3 seconds, the distance traveled is 135 metres.
a) Express s in terms of t
b) Find
i) the distance travelled in 5 seconds
ii) the time taken to travel the distance of 560 metres.
Date posted: August 9, 2019. Answers (1)
- The first term of an arithmetic progression (A.P) with six terms is P and its common difference is c. Another A.P with five terms has...(Solved)
The first term of an arithmetic progression (A.P) with six terms is P and its common difference is c. Another A.P with five terms has also its first term as P and a common difference of d, the last term of two arithmetic progression are equal.
a) Express d in terms of c
b) Given that the 4th term of the second AP exceeds the 4th term of the first one by 1 ½, find
the values and c and d .
c) Calculate the value of p if the sum of the terms A. P is 10 more than the sum of the terms
of the second A. P.
Date posted: August 9, 2019. Answers (1)
- Wanza sold a bag of potatoes for Sh. 420 and made a profit. If she sold it at Sh. 320, she could have
made a loss....(Solved)
Wanza sold a bag of potatoes for Sh. 420 and made a profit. If she sold it at Sh. 320, she could have
made a loss. Given that the profit is thrice the loss, how much did she pay for the bag of potatoes?
Date posted: August 9, 2019. Answers (1)