- A student at a certain college has a 60% chance of passing an examination at the first attempt.Each time a student fails and repeats the...(Solved)
A student at a certain college has a 60% chance of passing an examination at the first attempt.Each time a student fails and repeats the examination his chances of passing are increased by 15% Calculate the probability that a student in the college passes an examination at the second or at the third attempt.
Date posted: August 16, 2019. Answers (1)
- Given that the equation of the normal to the curve y = x2 + 3x +5 at point C is 5y + x =46 find...(Solved)
Given that the equation of the normal to the curve y = x2 + 3x +5 at point C is 5y + x =46 find the coordinates of C.
Date posted: August 16, 2019. Answers (1)
- Under a transformation whose matrix T is given below,a figure whose area is 2.5 cm2 is mapped onto a figure whose area is l0 cm2.Find...(Solved)
Under a transformation whose matrix T is given below,a figure whose area is 2.5 cm2 is mapped onto a figure whose area is l0 cm2.Find two possible values of a and hence write down two possible matrices.

Date posted: August 16, 2019. Answers (1)
- The line passing through the point C(-1,3t) and D (t,3) is parallel to the line whose equation is 2y – 3x = 9. Write down...(Solved)
The line passing through the point C(-1,3t) and D (t,3) is parallel to the line whose equation is 2y – 3x = 9. Write down the coordinates of C and D.
Date posted: August 16, 2019. Answers (1)
- Find y if log2y – 2 = log292(Solved)
Find y if log2y – 2 = log292
Date posted: August 16, 2019. Answers (1)
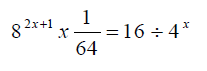
- Solve the equation(Solved)
Solve the equation

Date posted: August 16, 2019. Answers (1)
- Determine the value of subtracting the reciprocal of the expression below from 1.(Solved)
Determine the value of subtracting the reciprocal of the expression below from 1.

Date posted: August 16, 2019. Answers (1)
- A ship leaves port M and sails on a bearing of 0500 heading towards Island L. Two navy destroyers sail from a noval base N...(Solved)
A ship leaves port M and sails on a bearing of 0500 heading towards Island L. Two navy destroyers sail from a noval base N to intercept the ship. Destroyer A sails such that it covers the shortest distance possible. Destroyer B sails on a bearing of 200 to L. If the bearing of N from M is 1000 and distance NM=300Km, Using a scale of 1cm to represent 50Km, determine
i) the positions of M,N and L.
ii) the distance traveled by destroyer A.
iii) the distance traveled by destroyer B.
iv) the bearing of N from L.
Date posted: August 16, 2019. Answers (1)
- Maru Secondary School consumes 40 bags of maize and 25 bags of beans per term. Kadu Secondary School consumes 35 bags of maize and 18...(Solved)
Maru Secondary School consumes 40 bags of maize and 25 bags of beans per term. Kadu Secondary School consumes 35 bags of maize and 18 bags of beans per term. The schools purchase the grains from the same grain store. Maru pays sh.380,000 while Kadu pays sh.301,500 for the grains.
a) Write down two equations representing the cost of grains in the two schools.
b) Using matrix method , calculate the cost of each bag of maize and beans.
c) The following term the price of each bag of maize increased by 20% while that of beans decreased by 15%.
i) How much did Maru pay for the grains?
ii) If the school enrollment increased by 10% and the food ration also increased proportionally, how much would the school spend on the grains?
Date posted: August 16, 2019. Answers (1)
- Karis owns a farm that is triangular in shape as shown below.
a) Calculate the size of angle BAC.
b) Find the area of the farm in...(Solved)
Karis owns a farm that is triangular in shape as shown below.

a) Calculate the size of angle BAC.
b) Find the area of the farm in hectares.
c) Karis wishes to irrigate his farm using a sprinkler machine situated in the farm such that it is equidistant from points A,B and C.
i) Calculate the distance of the sprinkler from point C.
ii) The sprinkler rotates in a circular motion so that the maximum point reached by the water jets is the vertices A,B, and C. Calculate the area outside his farm that will be irrigated.
Date posted: August 16, 2019. Answers (1)
- John is a sales agent in a company that pays him a basic salary of sh.5000. In addition he is given a commission of 5%...(Solved)
John is a sales agent in a company that pays him a basic salary of sh.5000. In addition he is given a commission of 5% on sales worth sh.200, 000 and 7.5% on any additional sales above sh. 200,000.
a) In January his total sale was sh. 420,000. How much did he earn in total.
b) In February, his total earnings was sh.28125. Calculate his total sales in February.
c) The following year the company changed its policy to a flat rate commission of 9% on goods sold. In the first month, John sold goods worth sh.450,000. Find the percentage change in earning compared to the old policy.
Date posted: August 16, 2019. Answers (1)
- Solve the equation(Solved)
Solve the equation
Date posted: August 16, 2019. Answers (1)
- A measuring cylinder of radius 5cm contains water whose level reads 6cm high. A spherical object is immersed in the water and the new level...(Solved)
A measuring cylinder of radius 5cm contains water whose level reads 6cm high. A spherical object is immersed in the water and the new level reads 10cm. Calculate the radius of the spherical object.
Date posted: August 16, 2019. Answers (1)
- The table below shows the number of children per house in a certain village.Calculate
(i) The mean number of children per house to the nearest whole...(Solved)
The table below shows the number of children per house in a certain village.

Calculate
(i) The mean number of children per house to the nearest whole number.
(ii) The median
Date posted: August 16, 2019. Answers (1)
- In triangle ABC below, AC=BC, AB is parallel to DE, AB=15cm, DE=7.5cm and BE=6cm.
Calculate
a) Length CE
b) Area of quadrilateral ABED.(Solved)
In triangle ABC below, AC=BC, AB is parallel to DE, AB=15cm, DE=7.5cm and BE=6cm.

Calculate
a) Length CE
b) Area of quadrilateral ABED.
Date posted: August 16, 2019. Answers (1)
- Mr. Owino spends a quarter of his salary on school fees. He spends two-thirds of the remainder on food and a fifth of what is...(Solved)
Mr. Owino spends a quarter of his salary on school fees. He spends two-thirds of the remainder on food and a fifth of what is left on transport. He saves the balance. In a certain month he saved Sh.3400. What is his salary?
Date posted: August 16, 2019. Answers (1)
- Simplify the expression
(Solved)
Simplify the expression

Date posted: August 16, 2019. Answers (1)
- Construct a triangle PQT such that PQ = 10 cm QR = 9 cm and RP = 8 cm.
i) Construct the locus of the point...(Solved)
Construct a triangle PQT such that PQ = 10 cm QR = 9 cm and RP = 8 cm.
i) Construct the locus of the point x such that QX = XR and mark with the letter X the
point where this locus meets QR.
ii) Construct the locus of the point X such that QX = XR and mark with the letter X the
point where this locus meets QR
iii) Construct the locus of the point Y such that PY= 6cm and mark with the letter Y, the
point where the locus meets PR.
iv) By Shading the unwanted regions show the area bounded by the three loci by the
letter T such that QT≥ TR
PT ≤ 6 cm
angle PRT ≤ angle QRT
Label the region required by the letter T.
Date posted: August 15, 2019. Answers (1)
- Tsuma bought some rice at sh 30 per kg.He packed two- fifths of the rice in 2kg packets which he sold at shs. 85 per...(Solved)
Tsuma bought some rice at sh 30 per kg.He packed two- fifths of the rice in 2kg packets which he sold at shs. 85 per packet. He packed the other three- fifths in 3 kg packets and sold thee at shs. 120 per packet. He sold all the rice in this way and made a profit of sh. 4400.
a) Determine the amount of rice bought.
b) Calculate to one decimal place.
i) The percentage profit he made.
ii) The percentage profit she would have made if he had sold all the rice in 2kg packet.
Date posted: August 15, 2019. Answers (1)
- In The figure , The circle centre O is the circum circle of triangle PQR and also the in circle of triangle ABC.
Given that angle...(Solved)
In The figure , The circle centre O is the circum circle of triangle PQR and also the in circle of triangle ABC.

Given that angle BAC = 620 and angle ACB = 440
Calculate
a) < PQR
b) < QPR
c) < POQ
d) if BC = 10 cm, calculate the radius of the circle.
Date posted: August 15, 2019. Answers (1)