- The marked price of a modern camera is Kes 24,000. A trader sold it to a customer at a 10% discount.(Solved)
The marked price of a modern camera is Kes 24,000. A trader sold it to a customer at a 10% discount. If the trader still made a profit of 20% on the cost price, what was its cost price?
Date posted: August 19, 2019. Answers (1)
- If sin ? = 15/17 and ? is acute, find without using calculators or mathematical tables cos ? + tan ?.(Solved)
If sin Ф = 15/17 and Ф is acute, find without using calculators or mathematical tables cos Ф + tan Ф.
Date posted: August 19, 2019. Answers (1)
- The figure below is a semi-cylindrical solid of length 18cm and radius 3.5cm as shown(Solved)
The figure below is a semi-cylindrical solid of length 18cm and radius 3.5cm as shown.
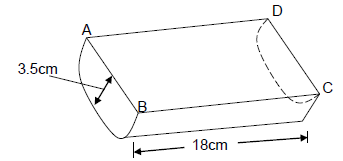
(a) Draw the labeled net of the solid.
(b) Find the surface area of the solid.
Date posted: August 19, 2019. Answers (1)
- a) Some articles are on sale at two different prices, the dealer being Ksh. 30 per dozen more than thecheaper ones. for kshs . 50,...(Solved)
a) Some articles are on sale at two different prices, the dealer being Ksh. 30 per dozen more than the cheaper ones. for kshs . 50, Mary get 9 articles more when she buy cheaper ones than when she by dealer ones. If the dealer articles cost Ksh. X per dozen,
(i) Write the terms of X the number of articles that Mary can buy in both cases.
(ii) Find the cost per dozen of each type of articles.
(b) Mary bought the cheaper articles and sold 3 dozens at a profit of 25 % what was the selling price of each article.
Date posted: August 19, 2019. Answers (1)
- The equation of a straight line L1 is given by 2y + 8x – 10 = 0.(Solved)
The equation of a straight line L1 is given by 2y + 8x – 10 = 0. Another line L2 cuts L1 at right angles such that the point of intersection of the two lines has coordinates (-3, k).
(a) Find the value of k.
(b) Hence find the equation of L2.
Date posted: August 19, 2019. Answers (1)
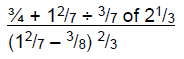
- Evaluate:(Solved)
Evaluate:
Date posted: August 19, 2019. Answers (1)
- A tower is on a bearing of 030o from a point P and a distance of 100 m. From P, the angle of elevation of...(Solved)
A tower is on a bearing of 030o from a point P and a distance of 100 m. From P, the angle of elevation of the top of the tower is 15o and the angle of depression of the foot of the tower is 1.
(a) Find the height of tower.
(b) A point Q is on the same horizontal plane as point P. The tower is on a bearing 330o from Q and a distance of 70 m.
Calculate the:-
(i) Bearing of Q from the tower.
(ii) The distance from P to Q
(iii) bearing of P from Q.
Date posted: August 19, 2019. Answers (1)
- The taxation rates for income earned in a certain year were as follows.
(Solved)
The taxation rates for income earned in a certain year were as follows.
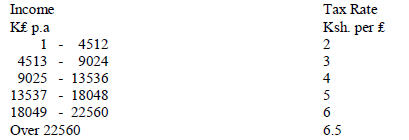
After a personal relief of Ksh.1056 per month Mrs. Wanjiru Njau paid tax amounting to Ksh. 18,152 that year.
(a) How much tax would she have paid if she did not have the personal relief
(b) Find her taxable income in K₤ that year.
(c) If Mrs. Wanjiru Njau receives allowances amounting to 18% of the taxable income, calculate his monthly basic salary to the nearest.
Date posted: August 19, 2019. Answers (1)
- The figure below shows two circles with centres O1 and O2 and intersecting at A and B.Angles AO1B = 60o, AO2B = 80o, AO1 =...(Solved)
The figure below shows two circles with centres O1 and O2 and intersecting at A and B.Angles AO1B = 60o, AO2B = 80o, AO1 = O1B = 8cm
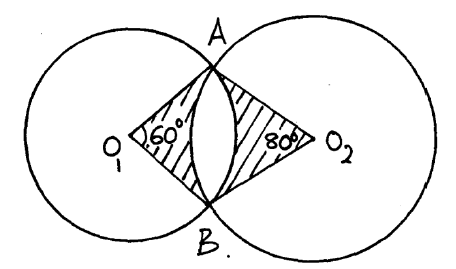
Calculate
(a) AB
(b) AO2
(c) Area of the shaded region.
Date posted: August 19, 2019. Answers (1)
- (a) A curve whose equation is in the form y = mx³ - nx where m and n are constants passes through the point (1,...(Solved)
(a) A curve whose equation is in the form y = mx³ - nx where m and n are constants passes through the point (1, 2). Its gradient at the given point is 10. Find the values of m and n.
(b) Use the trapezium rule to find the area bounded by the curve y = x² + 4, the x-axis and the lines
x = 0 and x = 4. Use five ordinates.
(c) Calculate the exact area bounded by the curve, y = x² + 4, the x-axis and the lines x = 0 and x = 4. Hence find the percentage error in (b) above.
Date posted: August 19, 2019. Answers (1)
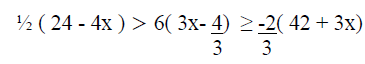
- Solve completely the following inequalities and represent the solution on the number line.(Solved)
Solve completely the following inequalities and represent the solution on the number line.
Date posted: August 19, 2019. Answers (1)
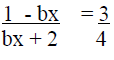
- Make x the subject of the formula.(Solved)
Make x the subject of the formula.
Date posted: August 19, 2019. Answers (1)
- The matrix given below has no inverse. Find k(Solved)
The matrix given below has no inverse. Find k

Date posted: August 19, 2019. Answers (1)
- Complete the table below for(Solved)
a) Complete the table below for 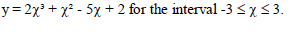
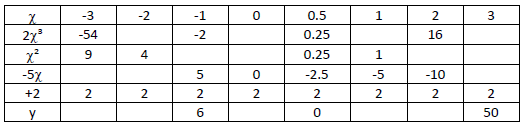
(b) Draw the graph of
(c) Use your graph to solve equation y = 2x³ + x² - 5x + 2
(d) Use your graph to solve equation y = 2x³ + x² - 11x - 10
(e) Find the gradient of the curve at x = 2.
Date posted: August 19, 2019. Answers (1)
- When the price of a packet of Kangumu was increase by sh.2, Kiptoo found that with his usual pocket money of sh. 600, he could...(Solved)
When the price of a packet of Kangumu was increase by sh.2, Kiptoo found that with his usual pocket money of sh. 600, he could buy 3 packets of kangumu fewer than before. Determine the current price of a packet of kangumu.
Date posted: August 19, 2019. Answers (1)
- PQ = QR = RS =ST = 1m. ? PQR = ? PST = 90o.
(i) If PR = vx metres, find x.
(ii) Calculate the...(Solved)
PQ = QR = RS =ST = 1m. ∠ PQR = ∠ PST = 90o.
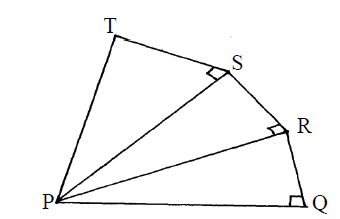
(i) If PR = √x metres, find x.
(ii) Calculate the exact length of PT.
Date posted: August 19, 2019. Answers (1)
- Solve the equation:(Solved)
Solve the equation:
Date posted: August 19, 2019. Answers (1)
- The sum of the first 16 terms of an A.P is 2000. The sum of the next four terms is 900.(Solved)
The sum of the first 16 terms of an A.P is 2000. The sum of the next four terms is 900. Calculate the first term and the common difference.
Date posted: August 19, 2019. Answers (1)
- One interior angle of a polygon is equal to 80° and each of the other interior angles are 128°(Solved)
One interior angle of a polygon is equal to 80° and each of the other interior angles are 128°. Find the number of sides of the polygon.
Date posted: August 19, 2019. Answers (1)
- Using a pair of compasses and a ruler only construct a triangle ABC such that AB = 6cm, BC = 8cm (Solved)
(a) Using a pair of compasses and a ruler only construct a triangle ABC such that AB = 6cm, BC = 8cm and ABC = 135°.
(b) Construct the height of triangle ABC in (a) above taking BC as the base and measure the height.
Date posted: August 19, 2019. Answers (1)