- The frequency distribution table below represents the number of kilograms of meat sold in butchery.(Solved)
The frequency distribution table below represents the number of kilograms of meat sold in butchery.
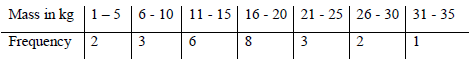
a) State the modal frequency.
b) Calculate the mean mass using assumed mean of 18kg.
c) Calculate the median mass.
Date posted: August 28, 2019. Answers (1)
- The figure below is a model representing a rocket capsule. The model whose total height is 15cm is
made up of a conical top(Solved)
The figure below is a model representing a rocket capsule. The model whose total height is 15cm is
made up of a conical top; a hemispherical bottom and the middle part is cylindrical. The radius of the
base of the cone and that of the hemisphere are each 3cm. The height of the cylindrical part is 8cm.
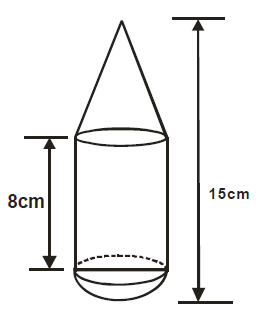
a) Calculate the external surface area of the model.
b) The actual rocket has a total height of 6 metres. The outside of the actual rocket capsule is to be
painted. Calculate the amount of paint required if an area of 20m2 requires 0.75 litres of the paint.
Date posted: August 28, 2019. Answers (1)
- A jet flies from town Q (60ºS, 24ºE) to town R (60ºS, 10ºW) and then due north for 1200 nautical miles to town S.
(a) Obtain...(Solved)
A jet flies from town Q (60ºS, 24ºE) to town R (60ºS, 10ºW) and then due north for 1200 nautical miles to town S.
(a) Obtain the latitude of S.
(b) Calculate the distance between Q and R in
(i) Nautical miles.
(ii) km
(c) Find the total flight time if the jet flies at an average speed of 800 knots.
Date posted: August 28, 2019. Answers (1)
- A trader sold an item at sh7500 after allowing his customer 15% discount on the marked price of the item.(Solved)
A trader sold an item at sh7500 after allowing his customer 15% discount on the marked price of the item. In so doing he made a profit of 35%.
a) Calculate
i) The marked price of the item
ii) The price at which the trader had bought the item.
b) If the trader had sold the item without giving a discount, calculate the percentage profit he would have made.
c) To clear his stock the trader decided to sell the remaining items at a loss of 10%. Calculate the price at which he sold each item.
Date posted: August 28, 2019. Answers (1)
- The distance between two towns A and B is 760km. A minibus left town A at 8: 15am and traveled towards B at an average...(Solved)
The distance between two towns A and B is 760km. A minibus left town A at 8: 15am and traveled towards B at an average speed of 90km/h. A matatu left B at 10:35am and on the same day and travelled towards A at an average speed of 110km/h.
(a) (i) How far from A did they meet?
(ii) At what time did they meet?
(b) A motorist starts from his home at 10:30am on the same day and travelled at an average speed of 100km/h. He arrived at B at the same time as the minibus. Calculate the distance from B to his home.
Date posted: August 28, 2019. Answers (1)
- The diagram below (not drawn to scale) represents the cross-section of a solid prism to 8.0cm.(Solved)
The diagram below (not drawn to scale) represents the cross-section of a solid prism to 8.0cm.
(a) Calculate the volume of the prism.
(b) Given that the density of the prism is 5.75g/cm³, calculate it’s mass in grams.
(c) A second prism is similar to the first one but is made of a different material.
The volume of the second prism is 246.24cm³.
(i) Calculate the area of the cross-section of the second prism.
(ii) Given that the ratio of the mass of the first prism to that of the second is 2: 5, find the density of the second prism.
Date posted: August 28, 2019. Answers (1)
- Mutwapa Primary School is 30km on a bearing of 015º from a tourist hotel. The nearest town is 45km from the school on a bearing...(Solved)
Mutwapa Primary School is 30km on a bearing of 015º from a tourist hotel. The nearest town is 45km from the school on a bearing of 120º.
(a) Using a scale of 1cm to represent 15km, make a scale drawing of the positions of the school the tourist hotel and the town.
(b) How far is the tourist hotel from the town?
(c) What is the bearing of
(i) the town from the tourist hotel?
(ii) the school from the town?
Date posted: August 28, 2019. Answers (1)
- Given that P = 3y express the equation 32y-1 + 2 x 3y-1 in terms of P.
Hence or otherwise find the value of y in...(Solved)
Given that P = 3y express the equation 32y-1 + 2 x 3y-1 in terms of P.
Hence or otherwise find the value of y in the equation 32y-1 + 2 x 3y-1 = 1.
Date posted: August 28, 2019. Answers (1)
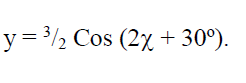
- State the amplitude and the period of the function below(Solved)
State the amplitude and the period of the function below
Date posted: August 28, 2019. Answers (1)
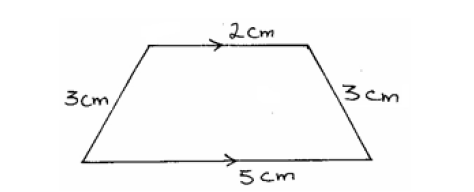
- In the fig below. Calculate the difference between the area and perimeter of the shaded part.(Solved)
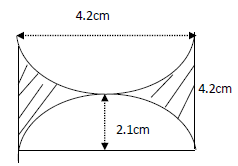
In the fig below. Calculate the difference between the area and perimeter of the shaded part.
Date posted: August 28, 2019. Answers (1)
- The angle of elevation of the top of a storey building from point P is 23.61º. From another point Q six metres nearer to the...(Solved)
The angle of elevation of the top of a storey building from point P is 23.61º. From another point Q six metres nearer to the base of the building, the angle of depression from the top of the building is 35º. Calculate to 1 decimal place the height of the building.
Date posted: August 28, 2019. Answers (1)
- Find the range of values of x which satisfy the following inequalities simultaneously(Solved)
Find the range of values of x which satisfy the following inequalities simultaneously and represent them on a number line.

Date posted: August 28, 2019. Answers (1)
- A line L is perpendicular to 2x + y = 3 and passes through point (4, -1). Determine
(i) the equation of line L.
(ii) the...(Solved)
A line L is perpendicular to 2x + y = 3 and passes through point (4, -1). Determine
(i) the equation of line L.
(ii) the acute angle that line L makes with the x-axis.
Date posted: August 28, 2019. Answers (1)
- The length and width of a rectangle are stated as 18.5cm and 12.4cm respectively.(Solved)
The length and width of a rectangle are stated as 18.5cm and 12.4cm respectively. Both measurements are given to the nearest 0.1cm.
Calculate the percentage error in the area.
Date posted: August 28, 2019. Answers (1)
- Solve the equation.(Solved)
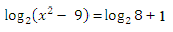
Solve the equation.
Date posted: August 28, 2019. Answers (1)
- Find the integral value of x which satisfy the inequality.(Solved)
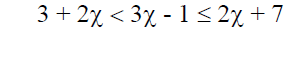
Find the integral value of x which satisfy the inequality.
Date posted: August 28, 2019. Answers (1)
- Solve for theta in the equation(Solved)
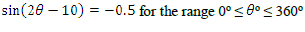
Solve for theta in the equation
Date posted: August 28, 2019. Answers (1)
- Find the smallest number which leaves a reminder of 4 when divided by either 8 or 12 or 14.(Solved)
Find the smallest number which leaves a reminder of 4 when divided by either 8 or 12 or 14.
Date posted: August 28, 2019. Answers (1)
- Find the area of an equilateral triangle whose sides are 18cm.(Solved)
Find the area of an equilateral triangle whose sides are 18cm.
Date posted: August 28, 2019. Answers (1)
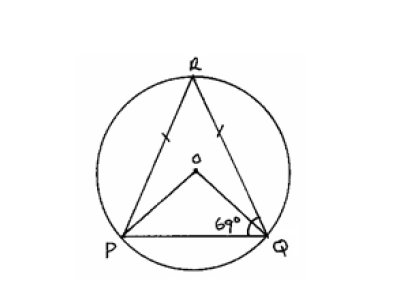
- In the figure below O is the centre of the circle. Given that PR = QR and angle PQR = 69º.Find angle RQO.(Solved)
In the figure below O is the centre of the circle. Given that PR = QR and angle PQR = 69º. Find angle RQO.
Date posted: August 28, 2019. Answers (1)