- Solve for x in the equation.(Solved)
Solve for x in the equation.
Log55 + log16x =3
Date posted: September 2, 2019. Answers (1)
- Without using a calculator evaluate leaving the answer as a fraction in its simplest form(Solved)
Without using a calculator evaluate leaving the answer as a fraction in its simplest form
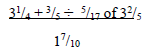
Date posted: September 2, 2019. Answers (1)
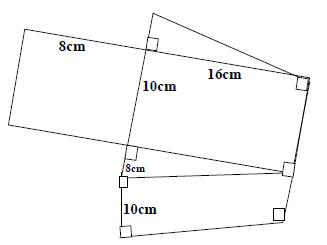
- The figure below is a cut out net of a wedge. Find its volume.(Solved)
The figure below is a cut out net of a wedge. Find its volume.
Date posted: September 2, 2019. Answers (1)
- Two beakers of exactly similar shape can hold 250ml and 200ml of liquid respectively. If the surface area of the larger beaker is 400cm2, calculate...(Solved)
Two beakers of exactly similar shape can hold 250ml and 200ml of liquid respectively. If the surface area of the larger beaker is 400cm2, calculate the surface area of the smaller one.
Date posted: September 2, 2019. Answers (1)
- A straight line passing through the point (-3,4) is perpendicular to the line whose equation is 2y-3x=11 and intersects the x-axis and y-axis at points...(Solved)
A straight line passing through the point (-3,4) is perpendicular to the line whose equation is 2y-3x=11 and intersects the x-axis and y-axis at points P and Q respectively. Find P.
Date posted: September 2, 2019. Answers (1)
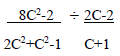
- Simplify completely(Solved)
Simplify completely
Date posted: September 2, 2019. Answers (1)
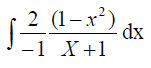
- Evaluate the expression below(Solved)
Evaluate the expression below
Date posted: August 30, 2019. Answers (1)
- A (50°S,20°E) and B(50°S,60°W) are two points on the earth’s surface. Calculate the distance between A and B in kilometer along the great circle. (take...(Solved)
A (50°S,20°E) and B(50°S,60°W) are two points on the earth’s surface. Calculate the distance between A and B in kilometer along the great circle. (take radius of the earth to be 6370km).
Date posted: August 30, 2019. Answers (1)
- 3cm3 of water is added to 2cm3 of a certain medicine which cost sh.12 per cm3. The chemist sells the diluted medicine at sh.4.50 per...(Solved)
3cm3 of water is added to 2cm3 of a certain medicine which cost sh.12 per cm3. The chemist sells the diluted medicine at sh.4.50 per cm3. Calculate the percentage profit.
Date posted: August 30, 2019. Answers (1)
- A contractor employs 40 men to do a piece of work in 60 days each man working 9 hours a day. He is then requested...(Solved)
A contractor employs 40 men to do a piece of work in 60 days each man working 9 hours a day. He is then requested to do the job in 48days. How many more men working l0 hours a day does he need to employ.
Date posted: August 30, 2019. Answers (1)
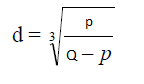
- Make P the subject of the formula given.(Solved)
Make P the subject of the formula given.
Date posted: August 30, 2019. Answers (1)
- The data below shows marks scored by 8 form four students in Ikutha district mathematics contest 44,32,67. 52, 28, 39, 46, 64.Calculate the mean absolute...(Solved)
The data below shows marks scored by 8 form four students in Ikutha district mathematics contest 44,32,67. 52, 28, 39, 46, 64.Calculate the mean absolute deviation.
Date posted: August 30, 2019. Answers (1)
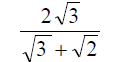
- Write in the simplest form using a rational denominator.(Solved)
Write in the simplest form using a rational denominator.
Date posted: August 30, 2019. Answers (1)
- a) Write down the first five terms of the expansion of
b) Using the first three terms of the expansion. Find the values of (1.01)5...(Solved)
a) Write down the first five terms of the expansion of

b) Using the first three terms of the expansion. Find the values of (1.01)5 to 4dp.
Date posted: August 30, 2019. Answers (1)
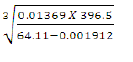
- By use of logarithms evaluate;(Solved)
By use of logarithms evaluate;
Date posted: August 30, 2019. Answers (1)
- The diagram below not drawn to scale shows part of the curve y = x2 + 5 and the line y = 8 – 2x....(Solved)
The diagram below not drawn to scale shows part of the curve y = x2 + 5 and the line y = 8 – 2x. The line intersects the curve at a point C and D. Lines AC and BD are parallel to the y-axis.
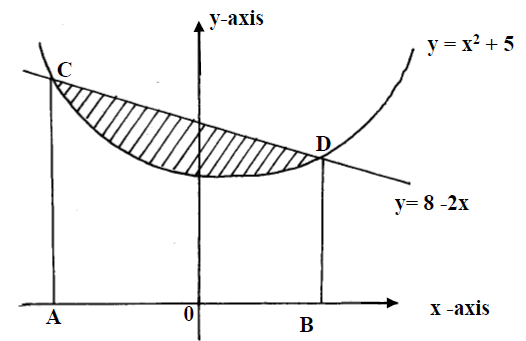
(a) Determine the coordinates of C and D
(b) Use integration to calculate the area bounded by the curve and x – axis between the points C and D.
(c) Calculate the area enclosed by the lines CD, CA, BD and the x-axis.
(d)Hence determine the area of the shaded region.
Date posted: August 30, 2019. Answers (1)
- (a) Construct rectangle ABCD with side AB = 6.4cm and diagonal AC = 8cm.
(b)Locus, L1, is a set of points equidistant from A and...(Solved)
(a) Construct rectangle ABCD with side AB = 6.4cm and diagonal AC = 8cm.
(b)Locus, L1, is a set of points equidistant from A and B and locus, L2, is a set of points equidistant
from BC and BA. If L1 and L2 meets at N inside the rectangle, locate point N.
(c)A point x is to be located inside the rectangle such that it is nearer B than A and also nearer AB than BC. If its not greater than 3cm from N shade the region where the points could be located.
Date posted: August 30, 2019. Answers (1)
- A ship sailed from a point P (50S, 120E) northwards to port Q(50N, 120E) then onto port R (50N, 140W).
(a)Calculate the distance in nm between
(i)P...(Solved)
A ship sailed from a point P (50S, 120E) northwards to port Q(50N, 120E) then onto port R (50N, 140W).
(a)Calculate the distance in nm between
(i)P and Q
(ii)Q and R
(b) If the speed of the ship between P and Q was 50 knots and between Q and R was 74 knots, how long did it take the ship to sail from point P to port R.?
Date posted: August 30, 2019. Answers (1)
- The curve y = 2x2 – 6x + 9 passes through the point P(2, 5)
(a) Determine the gradient function of the curve.
(b) Determine the coordinates...(Solved)
The curve y = 2x2 – 6x + 9 passes through the point P(2, 5)
(a) Determine the gradient function of the curve.
(b) Determine the coordinates and nature of the turning point of the curve
(c) Find the equation in the form y = mx + c of the
(i)Tangent to curve at P
(ii) Normal to the curve at P
Date posted: August 30, 2019. Answers (1)
- A form four class at Kiptulwo secondary school has 15 girls and 25 boys. The probability of a girl completing the secondary school course is...(Solved)
A form four class at Kiptulwo secondary school has 15 girls and 25 boys. The probability of a girl completing the secondary school course is 3/5 and that of a boy is 4/5.
(a) A student is picked at random from the class. Find the probability that;
(i)The student picked is a girl and will complete the course.
(ii) The student will not complete the course.
(b)Two students are picked at random from the class. Find the probability that;
(i) Both are girls
(ii)Both are of the same gender and will complete the course.
Date posted: August 30, 2019. Answers (1)