
-Increase in cost of production
-Shortage of inputs
-Exit of firms from the industry
-Price of related products is low
-Use of poor technology
-Future expectations of decrease in price
-Unfavorable natural factors /weather
-Price of the product has reduced
(i) An increase in either costs of production or inputs such as raw material and labour will make producers to reduce production/force some producers out of market.
(ii) In availability/inadequate factors of production.
(iii) Decrease in price of a good produced jointly with commodity X.
(iv) Increase in price of a commodity that may be produced in place of commodity X.
(v) Low levels of technology applied in production of the commodity.
(vi) Increase in tax charged on commodity.
(vii) Decrease in subsidies offered by government in production of the commodity.
(viii) Future expectation that the price of the commodity will increase.
(ix) Unfavorable climatic condition such was drought and floods especially if commodity is an agricultural commodity.
sharon kalunda answered the question on September 3, 2019 at 07:44
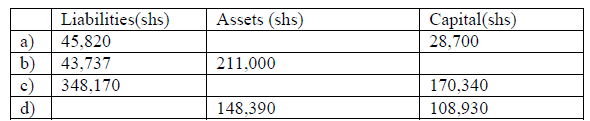
- Using the accounting equation, fill in the missing figures in the following table.(Solved)
Using the accounting equation, fill in the missing figures in the following table.
Date posted: September 3, 2019. Answers (1)
- Give four reasons that make insurance companies decline to insure acts of nature.(Solved)
Give four reasons that make insurance companies decline to insure acts of nature.
Date posted: September 3, 2019. Answers (1)
- The following is a cash book that was extracted from Manyatta traders for the month of February 2009.
Describe the transactions which took place on the...(Solved)
The following is a cash book that was extracted from Manyatta traders for the month of February 2009.
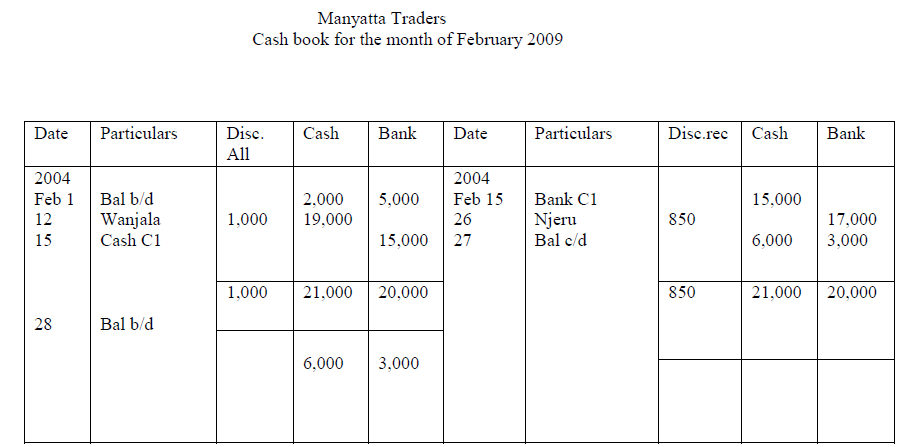
Describe the transactions which took place on the dates given below.
i) February 1
ii) February 12
iii) February 15
iv)February 26
Date posted: September 3, 2019. Answers (1)
- State four circumstances under which photocopying may be used to reproduce documents in a school.(Solved)
State four circumstances under which photocopying may be used to reproduce documents in a school.
Date posted: September 3, 2019. Answers (1)
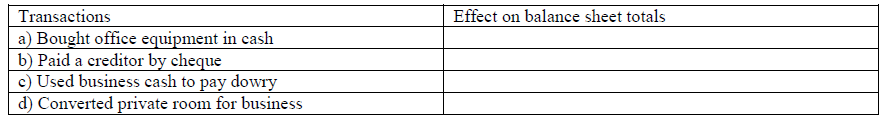
- State whether each of the following transactions increased, decreased or had no effects on the balance sheet totals.(Solved)
State whether each of the following transactions increased, decreased or had no effects on the balance sheet totals.
Date posted: September 3, 2019. Answers (1)
- Diana, Peter and James have been running a business as a partner without a written agreement. Advice them on the following matters as per the...(Solved)
Diana, Peter and James have been running a business as a partner without a written agreement. Advice them on the following matters as per the partnership Act.
a) Profit and loss sharing
b) Salary to partners
c) Loans given to the business by the partner
d) Admission of a new partner
Date posted: September 3, 2019. Answers (1)
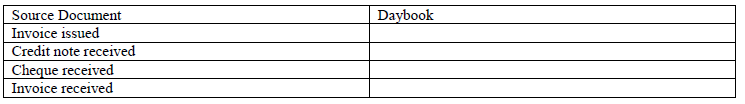
- For each of the following sources document name the relevant day book.(Solved)
For each of the following sources document name the relevant day book.
Date posted: September 2, 2019. Answers (1)
- On 1st of October 2009 Sambu bought goods on credit quoted at Kshs.240,000. Terms of sales were 20% trade discount and 10% cash discount if...(Solved)
On 1st of October 2009 Sambu bought goods on credit quoted at Kshs.240,000. Terms of sales were 20% trade discount and 10% cash discount if payment was made on 29TH October 2009. Calculate the amount paid if payment was made on 26th October 2009.
Date posted: September 2, 2019. Answers (1)
- In the table below classify the accounts as personal, nominal, real or private.(Solved)
In the table below classify the accounts as personal, nominal, real or private.
Account........................... Account type
Machinery
Kamau( creditor)
Electricity bill
Rent income
Date posted: September 2, 2019. Answers (1)
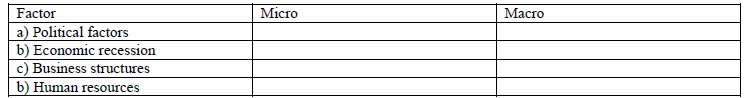
- Below are some factors that influence the operation of a business. By use of a tick indicate in the appropriate column the Business environment associated...(Solved)
Below are some factors that influence the operation of a business. By use of a tick indicate in the appropriate column the Business environment associated with each of the factors.
Date posted: September 2, 2019. Answers (1)
- The table below shows prices and quantity of a crate of tomatoes supplied at Kapsabet Market for the last quarter of year 2015.Explain five factors...(Solved)
The table below shows prices and quantity of a crate of tomatoes supplied at Kapsabet Market for the last quarter of year 2015.

Explain five factors that may have led to the change in quantities supplied.
Date posted: September 2, 2019. Answers (1)
- The following trial balance was extracted from the Books of Nandi Hills Enterprises for the year ended 31/12/2014.
Closing stock was valued at shs. 55,000 while...(Solved)
The following trial balance was extracted from the Books of Nandi Hills Enterprises for the year ended 31/12/2014.

Closing stock was valued at shs. 55,000 while depreciation on motor vehicles was shs. 15,000.
Required:
(i) Trading, Profit and Loss Account for the year ended 31st December 2014.
(ii) Balance Sheet as at 31st December 2014.
Date posted: September 2, 2019. Answers (1)
- Outline five circumstances that would make a person prefer a taxi rather than a matatu.(Solved)
Outline five circumstances that would make a person prefer a taxi rather than a matatu.
Date posted: September 2, 2019. Answers (1)
- Mrs. Baraka, a trader had the following cash transactions starting 1st January 2016.(Solved)
Mrs. Baraka, a trader had the following cash transactions starting 1st January 2016.
Jan 1 Balance b/d cash 5,000 bank 15,000
2 Bought goods for sale and paid by cheque 4,000
9 Paid insurance 150 cash
12 Received 250 cash from Mr. Kibet
14 Deposited 1,000 in the bank
16 Received by cheque 2,000 from Mchana
20 With drew 7,500 from bank for office use.
23 Paid wages 900 by cheque.
26 Received payment of 7,500 cheque from Joy Enterprises after allowing discount of shs. 100
28 Paid electricity 3,000 cash
30 Paid water 1,500 in cash
31 Settled Korir Traders account of sh. 2,250 and received a 10% discount.
Enter the above transactions in a three-column cashbook.
Date posted: September 2, 2019. Answers (1)
- The following information relates to Nyangores Traders as at 31st December 2000.Prepare Nyangores Traders Balance Sheet as at December 2000.(Solved)
The following information relates to Nyangores Traders as at 31st December 2000.

Prepare Nyangores Traders Balance Sheet as at December 2000.
Date posted: September 2, 2019. Answers (1)
- Read the following transactions and state the accounts to be debited or credited.
(i) Started business with sh. 50,000 in cash.
(ii) Sold goods worth sh....(Solved)
Read the following transactions and state the accounts to be debited or credited.
(i) Started business with sh. 50,000 in cash.
(ii) Sold goods worth sh. 30,000 receiving a cheque.
(iii) A debtor, Onyango returned goods to the business worth sh. 5,000.
(iv) Withdrew sh. 20,000 from the bank for business use.
Date posted: September 2, 2019. Answers (1)
- Henry‘s business had a mark-up of 25%. Calculate his margin.(Solved)
Henry‘s business had a mark-up of 25%. Calculate his margin.
Date posted: September 2, 2019. Answers (1)
- Mention four factors that may have caused the Demand curve to shift to the right.(Solved)
Mention four factors that may have caused the Demand curve to shift to the right.

Date posted: September 2, 2019. Answers (1)
- State four differences between subsistence production and large-scale production.(Solved)
State four differences between subsistence production and large-scale production.
Date posted: September 2, 2019. Answers (1)
- The following trial balance was extracted from the ledgers of Baraka Traders for the year ended 31st December 2015.(Solved)
The following trial balance was extracted from the ledgers of Baraka Traders for the year ended 31st December 2015.

On 31st December 2015, the business had closing stock valued at Shs. 60,000.
Required:
(i) The Trading, Profit and Loss Account for the year ended 31st December 2015.
(ii) A Balance Sheet as at that date.
Date posted: September 2, 2019. Answers (1)