- Using a well labelled diagram, illustrate movement along the demand curve.(Solved)
Using a well labelled diagram, illustrate movement along the demand curve.
Date posted: September 3, 2019. Answers (1)
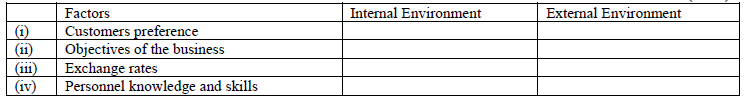
- Below are some of the factors that influence the operations of a business. Indicate with a tick (v) in the appropriate column the business environment...(Solved)
Below are some of the factors that influence the operations of a business. Indicate with a tick (√) in the appropriate column the business environment associated with each of the factor.
Date posted: September 3, 2019. Answers (1)
- Highlight FOUR Positive effects of a declining population.(Solved)
Highlight FOUR Positive effects of a declining population.
Date posted: September 3, 2019. Answers (1)
- State FOUR causes of structural inflation.(Solved)
State FOUR causes of structural inflation.
Date posted: September 3, 2019. Answers (1)
- In the spaces provided, indicate whether each of the following statements relate to preference shares or ordinary shares.
Statement.............................................. Types of shares
(i) Has voting rights
(ii) Rate...(Solved)
In the spaces provided, indicate whether each of the following statements relate to preference shares or ordinary shares.
Statement.............................................. Types of shares
(i) Has voting rights
(ii) Rate of dividend is fixed
(iii) Considered first in liquidation
(iv) Represent ownership
Date posted: September 3, 2019. Answers (1)
- The following trial balance was extracted from the books Mzalendo traders on 30th April 2005.
Stock at 30th April 2005 was 19,980
Required:
Prepare trading, profit and loss...(Solved)
The following trial balance was extracted from the books Mzalendo traders on 30th April 2005.
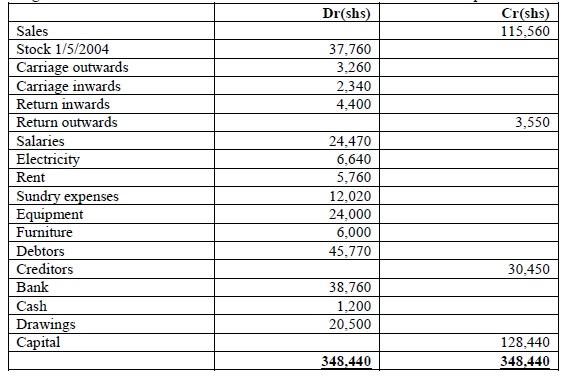
Stock at 30th April 2005 was 19,980
Required:
Prepare trading, profit and loss account for the year ended 30th April 2005.
Date posted: September 3, 2019. Answers (1)
- The following information was extracted from the books of Amani traders on.
Prepare Trial Balance of Amani traders for the month ended 31st December 2014.(Solved)
The following information was extracted from the books of Amani traders on.
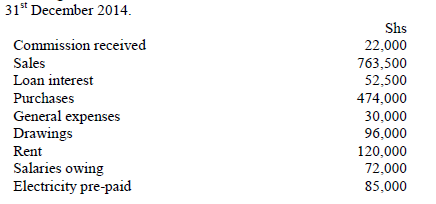
Prepare Trial Balance of Amani traders for the month ended 31st December 2014.
Date posted: September 3, 2019. Answers (1)
- The average consumer price for a 90kg bag of maize for the year 2012 and 2013 is shown below.(Solved)
The average consumer price for a 90kg bag of maize for the year 2012 and 2013 is shown below.
Year 2012................. 2013
Prices Ksh. 3000.............. Ksh. 4000
Calculate the increase in Consumer Price Index using 2012 as the base year.
Date posted: September 3, 2019. Answers (1)
- The following is an extract of a bank account of Komu traders for the month of June 2015.
State the transactions that took place on the...(Solved)
The following is an extract of a bank account of Komu traders for the month of June 2015.
State the transactions that took place on the following dates:
(a) June 5:
(b) June 10:
(c) June 20:
(d) June 25:
Date posted: September 3, 2019. Answers (1)
- On 1st July 2012, Mara traders had Sh.6,000 cash in hand and bank overdraft of Sh.2,000. During the month the following transactions took place:2012
July 2:...(Solved)
On 1st July 2012, Mara traders had Sh.6,000 cash in hand and bank overdraft of Sh.2,000. During the month the following transactions took place:2012
July 2: Received cheques from debtors totaling to Sh.50,000
July 5: Paid rent Sh.2,000 cash.
July 15: Withdrew Sh.5,000 from the bank for personal use.
July 25: Banked all the cash except Sh.1000
Prepare a Two-column Cash Book for the month.
Date posted: September 3, 2019. Answers (1)
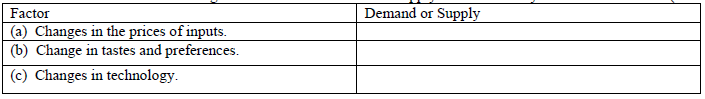
- Indicate whether each of the following factors influence demand or supply of a commodity.(Solved)
Indicate whether each of the following factors influence demand or supply of a commodity.
Date posted: September 3, 2019. Answers (1)
- State four reasons why short message services (SMS) is replacing letters as a way of communication.(Solved)
State four reasons why short message services (SMS) is replacing letters as a way of communication.
Date posted: September 3, 2019. Answers (1)
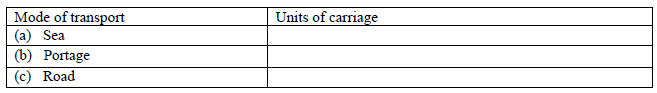
- State the unit of carriage for each of the following modes of transport.(Solved)
State the unit of carriage for each of the following modes of transport.
Date posted: September 3, 2019. Answers (1)
- Ndovu bought 200 blankets at Sh.500 each on credit. The terms of sale were 20% trade discount, 10% quantity discount and 5% cash discount if...(Solved)
Ndovu bought 200 blankets at Sh.500 each on credit. The terms of sale were 20% trade discount, 10% quantity discount and 5% cash discount if payment is made within two weeks. Calculate the amount paid if payment is made after one week.
Date posted: September 3, 2019. Answers (1)
- The following trial balance was prepared from the books of Joska Traders as at 31st Dec 2014.
(i)Prepare Joska Traders profit and loss account.
(ii) Calculate :
(a)...(Solved)
The following trial balance was prepared from the books of Joska Traders as at 31st Dec 2014.
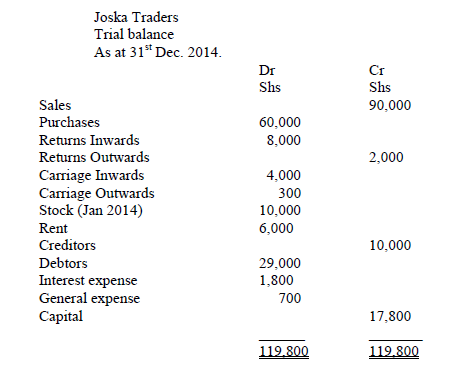
(i)Prepare Joska Traders profit and loss account.
(ii) Calculate :
(a) Mark up
(b) Margin
(c) R.O.S.T.O
Date posted: September 3, 2019. Answers (1)
- On 1 April 2014, Kama Traders had Sh 200,000 in cash and Sh 70,000 bank overdraft.
During the month the following transactions took place.
April 10 A...(Solved)
On 1 April 2014, Kama Traders had Sh 200,000 in cash and Sh 70,000 bank overdraft.
During the month the following transactions took place.
April 10 A debtor settled his account of sh 500,000 by cheque less 5% cash discount.
April 15: Settled Jane‘s account of sh 90,000 by cheque less 3% cash discount.
April 30: Banked all cash except sh 40,000.
Enter the above information in the cash book given.
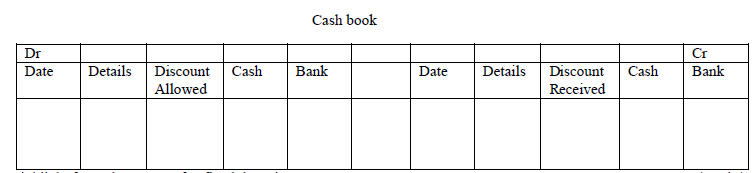
Date posted: September 3, 2019. Answers (1)
- The following information was extracted from the books of Sunrise Enterprise on 30th June 2012
Prepare the Trading account of Sunrise Enterprise for the year ended...(Solved)
The following information was extracted from the books of Sunrise Enterprise on 30th June 2012
Prepare the Trading account of Sunrise Enterprise for the year ended 30th June 2012.
Date posted: September 3, 2019. Answers (1)
- The following information was obtained from the records of Biashara traders as at 31st December 2014. ...(Solved)
The following information was obtained from the records of Biashara traders as at 31st December 2014.
Sh.
Long term loan............................ 20,000
Debtors ...................................6,000
Cash at bank ..............................24,000
Creditors .................................14, 000
Furniture .................................40,000
Stock..................................... 10,000
Prepare Biashara Traders balance sheet as at 31st December 2014.
Date posted: September 3, 2019. Answers (1)
- Using a diagram illustrate the effects of a rightward shift in supply curve on equilibrium price and quantity.(Solved)
Using a diagram illustrate the effects of a rightward shift in supply curve on equilibrium price and quantity.
Date posted: September 3, 2019. Answers (1)
- The following balances were extracted from the books of Mutwiri Traders for the year ended 31st December 2011. ...(Solved)
The following balances were extracted from the books of Mutwiri Traders for the year ended 31st December 2011.
Shs.
Gross profit ...........................76,200
Stock (31 st Dec.) .....................160,400
Cash ...................................210,120
Motor vehicle ..........................1,206,000
Capital .................................1,207,120
Equipment ...............................401,200
Furniture ................................188,800
Creditors .................................248,400
Debtors ..................................151,800
Discount received .......................52,800
Salaries ...............................24,800
Carriage outward....................... 28,800
Rent income ............................25,200
Advertising.............................. 44,400
Insurance................................ 18,800
Bank overdraft ...........................825,400
Required:
(i) Prepare a profit and loss A/C for Mutwiri Traders for the year ended 31 st Dec.2011.
(ii) Prepare a balance sheet as at 31 st Dec.2011.
Date posted: September 3, 2019. Answers (1)