- (a) Complete the table below to 2 decimal places for
y = -x3 – x2 + 3x + 1(Solved)
(a) Complete the table below to 2 decimal places for
y = -x3 – x2 + 3x + 1
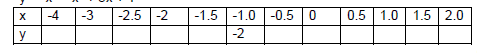
(b) On the grid provided, draw the graph for y = -x3 – x2 + 3x + 1 for -4 < x < 3.
(c) Use the graph to solve the equation -x3 – x2 + 3x + 1=0
(d) By drawing a suitable straight line on the graph, solve -x3 – x2 + 3x + 1 = -2x
Date posted: September 10, 2019. Answers (1)
- A metallic cuboid 8cm by 10cm by 14cm is melted.(Solved)
A metallic cuboid 8cm by 10cm by 14cm is melted. Half of it is used to make a cylinder of radius 4.2cm, the remaining is used to make a sphere. Determine using pi= 22/7
(a) The height and surface area of the cylinder to 1 decimal place.
(b) The radius and surface area of the sphere correct to 1 decimal place.
Date posted: September 10, 2019. Answers (1)
- A and B are two points 10cm apart.(Solved)
A and B are two points 10cm apart.
(a) Draw a circle centre A, radius 2cm and a circle centre B, radius 4cm.
(b) Draw a transverse common tangent to the two circles.
(c) Find by calculation the length of a direct common tangent correct to 3 significant figures.
Date posted: September 10, 2019. Answers (1)
- In the figure below, SP is parallel to QR.(Solved)
In the figure below, SP is parallel to QR.

(i) Show that triangles SPX and RQX are similar.
(ii) If PS = 8cm, PX = 6cm, SX = 4cm and RX = 3cm, find the length of RQ and QX.
Date posted: September 10, 2019. Answers (1)
- The ratio of a spherical balloon increases by 4%. Find the percentage increase in its;(Solved)
The ratio of a spherical balloon increases by 4%. Find the percentage increase in its;
(a) Surface area.
(b) Volume
Date posted: September 10, 2019. Answers (1)
- The diagram ABCD is a parallelogram. Line BE is parallel to line FD.(Solved)
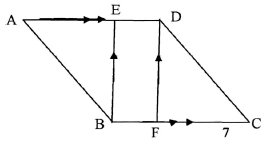
The diagram ABCD is a parallelogram. Line BE is parallel to line FD. Show that triangles ABE and CDF are congruent. Show that triangles ABE and CDF are congruent.
Date posted: September 10, 2019. Answers (1)
- How many terms of the arithmetic series 2, 5, 8, 11 …. May be added to make their sum 301?(Solved)
How many terms of the arithmetic series 2, 5, 8, 11 …. May be added to make their sum 301?
Date posted: September 10, 2019. Answers (1)
- The graph below is a velocity time graph(Solved)
The graph below is a velocity time graph
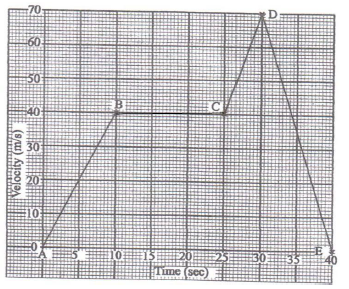
Determine the acceleration in the sections:
(a)
(i) CD
(ii) DE
(b) Calculate the total distance covered.
Date posted: September 10, 2019. Answers (1)
- The gradient of the curve is ax2 + 3x at x = 2 is 8.(Solved)
The gradient of the curve is ax2 + 3x at x = 2 is 8. Find the value of a.
Date posted: September 10, 2019. Answers (1)
- Factorise xy – zy – xw + zw hence simplify the expression completely.(Solved)
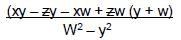
Factorise xy – zy – xw + zw hence simplify the expression completely.
Date posted: September 10, 2019. Answers (1)
- Given the matrix(Solved)
Given the matrix 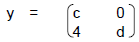
(a) Determine y2
(b) If y2 = I, determine the possible values of c and d.
Date posted: September 10, 2019. Answers (1)
- Expand (v5 + v3) (v5 – v3) hence or otherwise simplify by rationalising the denominator of (Solved)
Expand (√5 + √3) (√5 – √3) hence or otherwise simplify by rationalising the denominator of

Date posted: September 10, 2019. Answers (1)
- The diagonal of a rectangular flower garden is 20m.(Solved)
The diagonal of a rectangular flower garden is 20m. If the width of this garden is 8m, calculate its length and perimeter to 4 s.figures.
Date posted: September 10, 2019. Answers (1)
- The diagram below shows the region enclosed by inequalities.(Solved)
The diagram below shows the region enclosed by inequalities.
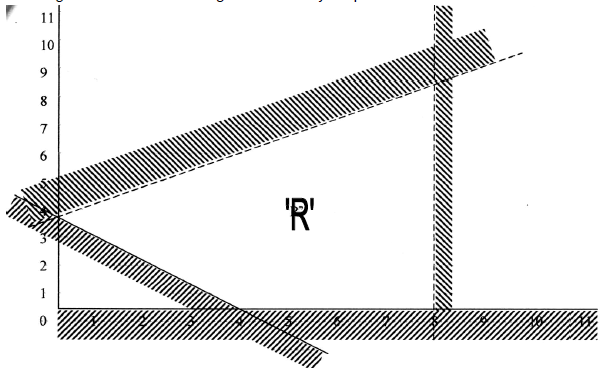
Determine the inequalities that defines the regions R.
Date posted: September 10, 2019. Answers (1)
- The column vectors of b, c and d are given as:(Solved)
The column vectors of b, c and d are given as:
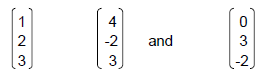
respectively and that P = b + 2c – d. Express vector P as a column vector and hence calculate the magnitude of P.
Date posted: September 10, 2019. Answers (1)
- Given that in a right angled triangle, sin ? = 5/12, find:(Solved)
Given that in a right angled triangle, sin theta = 5/12, find:
Cos (900 – θ)
Date posted: September 10, 2019. Answers (1)
- A tourist visited Kenya with 2500 U.S dollars and changed the U.S dollars into Kenya Shillings at a local bank in Kenya when the exchange...(Solved)
A tourist visited Kenya with 2500 U.S dollars and changed the U.S dollars into Kenya Shillings at a local bank in Kenya when the exchange rates at the time were as follows:
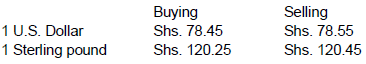
(a) How much did he get in Kenya shillings?
(b) While in Kenya, he used Shs. 80,000 and after his stay he converted the remaining amount into sterling pounds. Calculate, to 2 decimal places, the Sterling Pounds that he got.
Date posted: September 10, 2019. Answers (1)
- Without using a calculator, evaluate:(Solved)
Without using a calculator, evaluate:
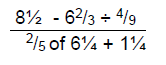
Date posted: September 10, 2019. Answers (1)
- Three boats X, y and Z are approaching a harbour H. X is 50km from the harbour on a bearing of 090°.(Solved)
Three boats X, y and Z are approaching a harbour H. X is 50km from the harbour on a bearing of 090°. Y is 80km from the harbour on a bearing of 130° and Z is due West of Y and on a bearing of 200° from the harbour.
(a) Using a scale of 1cm rep 10km make a scale drawing showing the positions of the three boats relative to the harbour.
(b)
(i) Using the scale drawing find; the distance between X and Y.
(ii) The distance of Z from the harbour
(iii) The distance between X and Z.
(iv) The compass bearing of X from Z.
Date posted: September 6, 2019. Answers (1)
- In the diagram below A is the point (2, 2)(Solved)
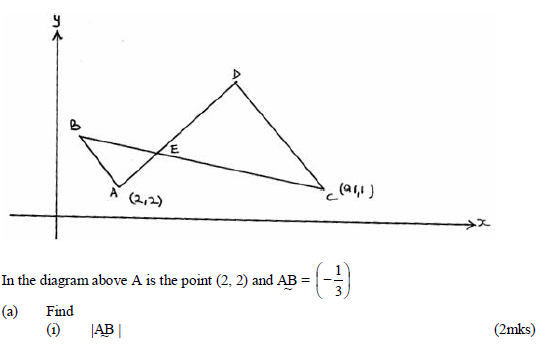
(ii) The coordinates of B.
(b) The point C is (9, 1) and CD = 3AB. Find
(i) the coordinates of D.
(c) The point E is (K, 4)
(i) Find in terms of K, the vector AE.
(ii) Give that AED is a straight line, find K.
Date posted: September 6, 2019. Answers (1)