-
The figure below shows an experimental set up consisting of a mounted convex lens L, cardboard screen with cross-wires at the centre, a plane mirror,...
(Solved)
The figure below shows an experimental set up consisting of a mounted convex lens L, cardboard screen with cross-wires at the centre, a plane mirror, a metre rule and a candle.

Describe how the set-up may be used to determine the focal length, f, of the lens.
Date posted:
September 10, 2019
.
Answers (1)
-
The figure shows a ray of light incident on a glass-air interface.
(Solved)
The figure shows a ray of light incident on a glass-air interface.

(i) Show on the diagram the critical angle, c.
(ii) Given that the refractive index of the glass is ang, and that the critical angle c = 42º, determine the value of is ang.
Date posted:
September 10, 2019
.
Answers (1)
-
The figure shown below illustrates crests of circular water wave-fronts radiating from a point source O in a pond.
(Solved)
The figure shown below illustrates crests of circular water wave-fronts radiating from a point source O in a pond.

State how the depth of the pond at A compares with that at B.
Date posted:
September 10, 2019
.
Answers (1)
-
State one example of a transverse-progressive wave.
(Solved)
State one example of a transverse-progressive wave.
Date posted:
September 10, 2019
.
Answers (1)
-
The figure below shows a wire carrying current whose direction is out of the paper. The wire is placed in a magnetic field.
(Solved)
The figure below shows a wire carrying current whose direction is out of the paper. The wire is placed in a magnetic field.

(a) Indicate on the figure the direction of the force F, acting on the wire.
(b) State what would be observed on the wire if the direction of the current is reversed (i.e. into the paper).
Date posted:
September 10, 2019
.
Answers (1)
-
State one application of soft iron in magnetism.
(Solved)
State one application of soft iron in magnetism.
Date posted:
September 10, 2019
.
Answers (1)
-
It is observed that when a rod A is brought near the cap of a negatively charged electroscope, the divergence of the leaf decreases. State...
(Solved)
It is observed that when a rod A is brought near the cap of a negatively charged electroscope, the divergence of the leaf decreases. State two deductions that can be made about rod A from this observation.
Date posted:
September 10, 2019
.
Answers (1)
-
A mass of 400g is rotated by a string at a constant speed V in a vertical circle of radius 100cm. The minimum tension in...
(Solved)
A mass of 400g is rotated by a string at a constant speed V in a vertical circle of radius 100cm. The minimum tension in the string is 7.2 N which is experienced at point T.

(i) Determine the velocity V of the mass at point T.
(ii) Determine the maximum tension in the string.
Date posted:
September 10, 2019
.
Answers (1)
-
The pressure of helium gas of volume 10cm³ decreases to one third of its original value at constant temperature.Determine the final volume of the gas.
(Solved)
The pressure of helium gas of volume 10cm³ decreases to one third of its original value at constant temperature.Determine the final volume of the gas.
Date posted:
September 10, 2019
.
Answers (1)
-
Figure below shows a graph of vapour pressure against the temperature of water vapour at Kerugoya town where mercury barometer indicates a height of 650mm.
(Solved)
Figure below shows a graph of vapour pressure against the temperature of water vapour at Kerugoya town where mercury barometer indicates a height of 650mm.
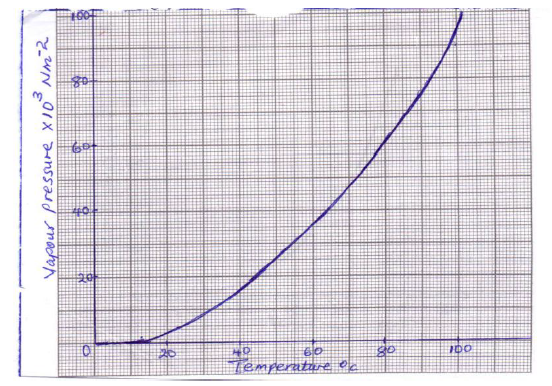
(i) Determine the atmospheric pressure of the town in Nmˉ².(Take g = 10m/s² and density of mercury = 13600kg/m³).
(ii) Use the graph to determine the boiling point of water in the town.
Date posted:
September 10, 2019
.
Answers (1)
-
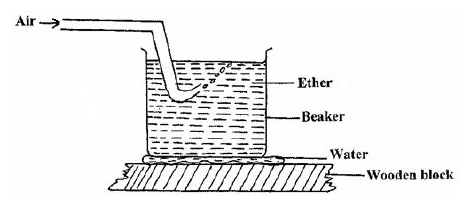
A beaker containing ether was placed on some water on a wooden block. Air was then blown through the ether using a pump as shown...
(Solved)
A beaker containing ether was placed on some water on a wooden block. Air was then blown through the ether using a pump as shown in figure below.State and explain what observation is made after sometime.
Date posted:
September 10, 2019
.
Answers (1)
-
The cooling curve shown in figure below is for a pure substance.
(Solved)
The cooling curve shown in figure below is for a pure substance.
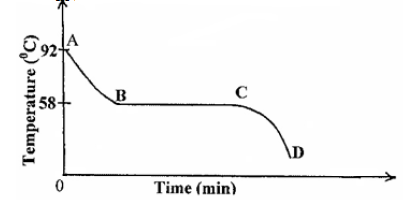
(i) What is the melting point of the substance?
(ii) Explain what happens in the region.
I CD
II AB
III BC
Date posted:
September 10, 2019
.
Answers (1)
-
9816J of heat energy is required to completely convert m kg of ice at 0ºC to steam. Determine the value of m.(Take latent heat of...
(Solved)
9816J of heat energy is required to completely convert m kg of ice at 0ºC to steam. Determine the value of m.(Take latent heat of fusion of ice = 2.34 x 10⁵Jkgˉ¹; specific heat capacity of water = 4200Jkgˉ¹kˉ¹, latent heat of vaporization of steam = 22.26 x 10⁶Jkgˉ¹).
Date posted:
September 10, 2019
.
Answers (1)
-
The figure shows a wheel and axle being used to raise a load W by applying an effort F. the radius of the large wheel...
(Solved)
The figure shows a wheel and axle being used to raise a load W by applying an effort F. the radius of the large wheel is R and of the small wheel r as shown.
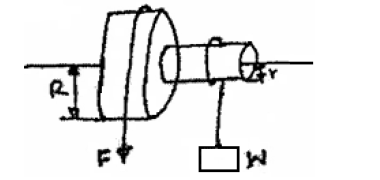
(i) Shows that the velocity ratio (V.R) of this machine is given by R/r.
(ii) Given that r = 5cm, R = 8cm, determine effort required to raise a load of 20N if the efficiency of the machine is 80%.
(iii) It is observed that the efficiency of the machines increases when it is used to lift large loads. Give a reason for this.
Date posted:
September 10, 2019
.
Answers (1)
-
Draw a single pulley arrangement with a velocity ratio of 2.
(Solved)
Draw a single pulley arrangement with a velocity ratio of 2.
Date posted:
September 10, 2019
.
Answers (1)
-
A ball of mass 0.2kg is thrown vertically upwards with velocity of 8ms¯¹. The air resistance is 0.5N. Determine:
(i) the resultant force on the ball...
(Solved)
A ball of mass 0.2kg is thrown vertically upwards with velocity of 8msˉ¹. The air resistance is 0.5N. Determine:
(i) the resultant force on the ball as it moves up;
(Take acceleration due to gravity g = 10msˉ²).
(ii) The acceleration of the ball.
(iii) The maximum height reached by the ball.
Date posted:
September 10, 2019
.
Answers (1)
-
A hot air balloon falling through the air attains terminal velocity after a short-time. State the reason why it attains terminal velocity.
(Solved)
A hot air balloon falling through the air attains terminal velocity after a short-time. State the reason why it attains terminal velocity.
Date posted:
September 10, 2019
.
Answers (1)
-
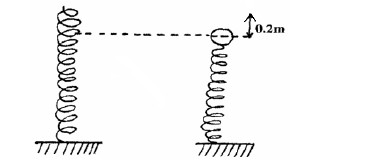
A steel ball of mass 0.05kg was placed on top of a spring on a level ground. The spring was then compressed through a distance...
(Solved)
A steel ball of mass 0.05kg was placed on top of a spring on a level ground. The spring was then compressed through a distance of 0.2m.If the spring constant is 15N/m. Calculate the maximum height reached when the spring is released.
Date posted:
September 10, 2019
.
Answers (1)
-
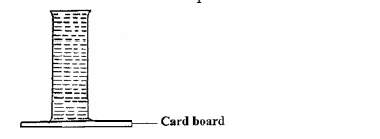
The figure below shows a long tube filled with water. The open end is then covered with a cardboard and tube is inverted. It is...
(Solved)
The figure below shows a long tube filled with water. The open end is then covered with a cardboard and tube is inverted. It is observed that the water in the tube does not spill out.Explain the observation.
Date posted:
September 10, 2019
.
Answers (1)
-
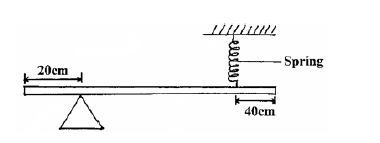
The figure below is a uniform bar of length 2.0m pivoted near one end. The bar is balanced horizontal by a spring.
(Solved)
The figure below is a uniform bar of length 2.0 m pivoted near one end. The bar is balanced horizontal by a spring.Given that the tension on the spring is 1.2N, determine the weight of the bar.
Date posted:
September 10, 2019
.
Answers (1)