- Every morning during class time, Brenda either reads a novel or solves Mathematics questions. The
probability that she reads a novel is 4/5. (Solved)
Every morning during class time, Brenda either reads a novel or solves Mathematics questions. The probability that she reads a novel is 4/5. If she reads a novel, there is a probability of 3/7 that she will fall asleep. If she solves Math’s questions there is a probability of 1/2 that she will fall asleep. Sometimes the teacher on duty enters Brenda’s classroom. When Brenda is asked whether she had been a sleep, there is a probability of 1/5 that she will admit that she had been asleep and a probability of 3/5 that she will claim to have been asleep.
Using a tree diagram;
Find the probability that
(i) She sleeps and admits it.
(ii) She sleeps and does not admit.
(iii) She does not sheep but claims to have been asleep.
(iv) She does not sleep and says that she has not been a slept.
(v) She sleeps and admits and changes her mind.
Date posted: September 11, 2019. Answers (1)
- (a) Fill the table below using the following function y = 3 + 4x - 2x²(Solved)
(a) Fill the table below using the following function y = 3 + 4x - 2x² 
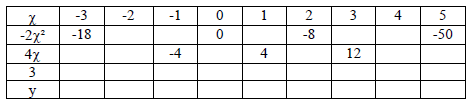
(b) On the grid provided, draw the graph of the function y = 3 + 4x - 2x²
(c) Using your graph; estimate the roots of the equations:-
(i) 3 + 4x = 2x².
(ii) 2x²- 3x - 6 = 0.
(d) State the y – co-ordinate of the maximum turning point.
Date posted: September 11, 2019. Answers (1)
- The figure below shows an arc of a circle through three points A, B and C.(Solved)
The figure below shows an arc of a circle through three points A, B and C.
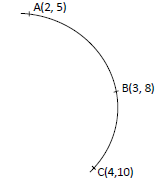
Calculate the co-ordinates of the centre of the circle.
Date posted: September 11, 2019. Answers (1)
- Water flows through a pipe whose cross sectional radius is 3.5cm at a rate of 3m/min.(Solved)
Water flows through a pipe whose cross sectional radius is 3.5cm at a rate of 3m/min. Calculate how long it will take the pipe to fill a 22000 litre Kentank.
Date posted: September 11, 2019. Answers (1)
- The position vectors of points A and B are 2i – j + 4K and 4i + 3j respectively.(Solved)
The position vectors of points A and B are 2i – j + 4K and 4i + 3j respectively. If point R is the midpoint of AB . Find the magnitude of AR
Date posted: September 11, 2019. Answers (1)
- A Kenya airways plane flies from point P(40°N, 45°W) to a point Q(35°N, 45°W), then to point T(35°N, 135°E). Find the shortest distance between Q...(Solved)
A Kenya airways plane flies from point P(40°N, 45°W) to a point Q(35°N, 45°W), then to point T(35°N, 135°E). Find the shortest distance between Q and T in nautical miles.
Date posted: September 11, 2019. Answers (1)
- Solve for x in the equation sin2 (3x + 30°) (Solved)
Solve for x in the equation 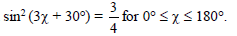
Date posted: September 11, 2019. Answers (1)
- The product of the digits in a two digit number is 24. Four times the ten digit exceeds the unit digit by
10. Calculate the number(Solved)
The product of the digits in a two digit number is 24. Four times the ten digit exceeds the unit digit by
10. Calculate the number
Date posted: September 11, 2019. Answers (1)
- The figure below drawn to scale represents a field in the shape of an equilateral triangle of sides 120m.(Solved)
The figure below drawn to scale represents a field in the shape of an equilateral triangle of sides 120m.
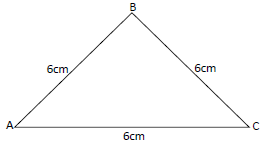
Mr. Mutai wants to plant some tea seedlings in the field. The seedling must be at most 90m from A and nearer to B than to C. If no seedling is to be more than 60m from BC, show by shading, the exact region where the seedling may be planted within the triangle.
Date posted: September 11, 2019. Answers (1)
- The equation of a curve is y = x³ - 3x² + Kx + 2 and a normal is 9y + x = 18.(Solved)
The equation of a curve is y = x³ - 3x² + Kx + 2 and a normal is 9y + x = 18. If they intersect at x = 0; Find the value of K.
Date posted: September 11, 2019. Answers (1)
- A commercial plot is valued at shs.500,000. The plot depreciates at a rate of 10% per six months for a period of 2 years.(Solved)
A commercial plot is valued at shs.500,000. The plot depreciates at a rate of 10% per six months for a period of 2 years. It then appreciates at a rate of 4% per quarter yearly for three years. Find the value of the plot after 5 years to nearest shillings.
Date posted: September 11, 2019. Answers (1)
- Hence use the expansion to evaluate (3.25)5 correct to 4 decimal places.(Solved)
Expand  up to the 5th team. Hence use the expansion to evaluate (3.25)5 correct to 4 decimal places.
Date posted: September 11, 2019. Answers (1)
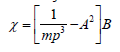
- Make P the subject of the formula:(Solved)
Make P the subject of the formula:
Date posted: September 11, 2019. Answers (1)
- In the figure shown below, angle PTS = 54° and PT and ST are tangents to the circle and that PR is parallel to TS.(Solved)
In the figure shown below, angle PTS = 54° and PT and ST are tangents to the circle and that PR is parallel to TS.
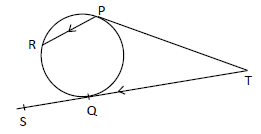
Giving reasons; find the values of angles:
(i) PRQ.
(ii) RQS.
Date posted: September 11, 2019. Answers (1)
- Solve for x in (log2x)2 + log28 = log2 x4(Solved)
Solve for x in (log2x)2 + log28 = log2 x4.
Date posted: September 11, 2019. Answers (1)
- A blend of juice is made from pineapple and passion. The cost of two limes of pineapple is 120/= and three limes of passion is...(Solved)
A blend of juice is made from pineapple and passion. The cost of two limes of pineapple is 120/= and three limes of passion is 270/=. In what ratio should the juice be mixed such that by selling the mixture at 84/= per lime a profit of 20% is realized?
Date posted: September 11, 2019. Answers (1)
- A pyramid block has a square base whose side is exactly 7.5cm.(Solved)
A pyramid block has a square base whose side is exactly 7.5cm. Its height measured to the nearest millimeter is 3.5cm. Find the percentage error in calculating its volume correct to 3 decimal places.
Date posted: September 11, 2019. Answers (1)
- Show by shading the unwanted region, the region which satisfies the following inequalities(Solved)
Show by shading the unwanted region, the region which satisfies the following inequalities
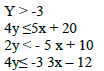
(b) calculate the area of this region in a square units
Date posted: September 10, 2019. Answers (1)
- Five towns V,W,X,UY and Z are situated such that W is 200km east of V.(Solved)
Five towns V,W,X,UY and Z are situated such that W is 200km east of V. X is 300km from W on a bearing of 150o. Y is 350km on a bearing of 240o from X. Z is 150o from V but 200o from X.
Draw the diagram representing the position of the towns. ( use a scale of 1cm to represent 50km) .
(b) From the diagram determine
(i) the distance in km of V from Z
(ii) The bearing of Y from W
(c) A plane heading to town X takes off from town y and flies upwards of a constant angle which
is less than 90o. After flying a distance of 350km in the air it sees town x at an angle of depression of 50o. Calculate the distance of the plane from x at this point to the nearest km.
Date posted: September 10, 2019. Answers (1)
- Find the scalars k and h(Solved)
Given that Km + hn = r and that  .
.
Find the scalars k and h
Date posted: September 10, 2019. Answers (1)