- Use a ruler and compass ONLY for all constructions in this question.
(a)Construct a triangle ABC in which AB=6 cm, BC= 7 cm and angle ABC...(Solved)
Use a ruler and compass ONLY for all constructions in this question.
(a)Construct a triangle ABC in which AB=6 cm, BC= 7 cm and angle ABC = 750.
(b)Measure
(i)the length of AC
(ii)the angle ACB
(c)(i)Construct the locus of p such that BP = PC
(ii)Construct the locus of Q such that Q is on the opposite side of BC as A and angle
BCQ = 300.
(d)(i)the locus of P and Q meet at X, mark X .
(ii)Construct the locus of R in which angle BRC = 1200.
Date posted: September 16, 2019. Answers (1)
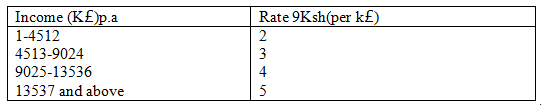
- The table below shows taxation rates in Kenya.
A civil servant is provided with a house and pays a nominal rent of Ksh. 6260 per Month....(Solved)
The table below shows taxation rates in Kenya.
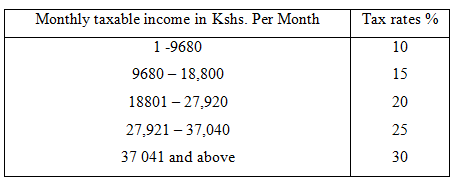
A civil servant is provided with a house and pays a nominal rent of Ksh. 6260 per Month. In addition the government gives him a medical allowance of Kshs. 7,000 p.m, entertainment allowance of Kshs. 3,000 p.m. He is entitled to a personal relief of Ksh. 1700 p.m. If the civil servants net tax is Kshs. 6,900 p.m.
Determine his :-
(a)Gross tax p.m
(b)Taxable income p.m
(c)Basic salary p.m
Date posted: September 16, 2019. Answers (1)
- During a charity walk to raise funds for displaced Kenyans in the election violence, Otieno, Omollo and David decided to walk from Kisumu to kisii...(Solved)
During a charity walk to raise funds for displaced Kenyans in the election violence, Otieno, Omollo and David decided to walk from Kisumu to kisii a distance of 250km, at an average speed of 4 km/hr. Each day they begin their walk at 6.00 a.m and after walking 4 hrs, take a break of 30 minutes then walk for the next 3 hrs after which they have a lunch break for 1 ½ hrs. Their final leg for the day last 3 hours.
(a)Find the time:-
(i)When their first break ends.
(ii)When their lunch time begins.
(iii)When their day ends.
(b)Find the number of days they will take to complete the journey.
Date posted: September 16, 2019. Answers (1)
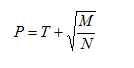
- Make N the subject of the formula.(Solved)
Make N the subject of the formula.
Date posted: September 16, 2019. Answers (1)
- In the figure below AB is parallel to DE and area of triangle DEC is 8cm2.
Find
(a)the value of X
(b)the area of triangle ADEB.
(Solved)
In the figure below AB is parallel to DE and area of triangle DEC is 8cm2.
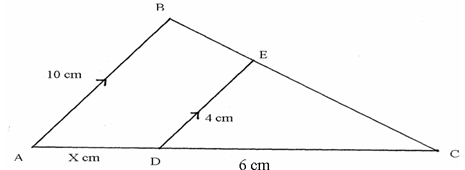
Find
(a)the value of X
(b)the area of triangle ADEB.
Date posted: September 16, 2019. Answers (1)
- If is a perfect square. Find the value of B.(Solved)
If 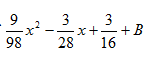 is a perfect square. Find the value of B.
Date posted: September 16, 2019. Answers (1)
- A computer whose marked price is sh. 40,000 is sold at sh. 56,000 on hire purchase terms. Mary bought the computer on hire purchase terms....(Solved)
A computer whose marked price is sh. 40,000 is sold at sh. 56,000 on hire purchase terms. Mary bought the computer on hire purchase terms. She paid a deposit of 25% of the hire purchase and cleared the balance by equal Monthly installments of sh. 2625. Calculate the rate of interest charged per Month.
Date posted: September 16, 2019. Answers (1)
- Given that OA = 3i + 2j - 4k and OB = 4i -2k and P divides AB externally in the ratio 3:2. Determine...(Solved)
Given that OA = 3i + 2j - 4k and OB = 4i -2k and P divides AB externally in the ratio 3:2. Determine the coordinates of P.
Date posted: September 16, 2019. Answers (1)
- A hot water tap fills a bath tab in 4 minutes, cold water tap fills the same bath tub in 8 minutes while a drainage...(Solved)
A hot water tap fills a bath tab in 4 minutes, cold water tap fills the same bath tub in 8 minutes while a drainage tap empties the bath tub in 2 minutes. If initially the bath tub is full and the three taps are opened at the same time. Find how long it takes to empty the bath tub.
Date posted: September 16, 2019. Answers (1)
- A curve has the equation . y= 3cos(4x + 600)
State
(a)amplitude
(b)Period
(c)phase angle.
(Solved)
A curve has the equation . y= 3cos(4x + 600)
State
(a)amplitude
(b)Period
(c)phase angle.
Date posted: September 16, 2019. Answers (1)
- The coordinates of the end points of the diameter of a circle are A(2,4)and B(-2,6). Find the equation of a circle in the form ...(Solved)
The coordinates of the end points of the diameter of a circle are A(2,4)and B(-2,6). Find the equation of a circle in the form
ax2 + by2 + cx + dy + e = 0
Date posted: September 16, 2019. Answers (1)
- The table below shows some values if the function y= x2 + x + 1
(a) Fill the blank spaces in the table.
(b) Use mid – ordinate...(Solved)
The table below shows some values if the function y= x2 + x + 1
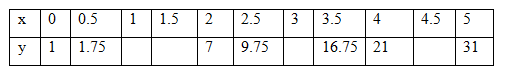
(a) Fill the blank spaces in the table.
(b) Use mid – ordinate rule with 5 strips to estimate the area bounded by the curve y= x2 + x + 1, y – axis, x-axis and the line x =5
Date posted: September 16, 2019. Answers (1)
- The cost of producing a commodity consists of transport, labour and raw materials in the ratio 8:4:12 respectively. If the transport cost increases by 12%,...(Solved)
The cost of producing a commodity consists of transport, labour and raw materials in the ratio 8:4:12 respectively. If the transport cost increases by 12%, labour cost by 18% and materials by 40%. Find the percentage increase of producing the new commodity.
Date posted: September 16, 2019. Answers (1)
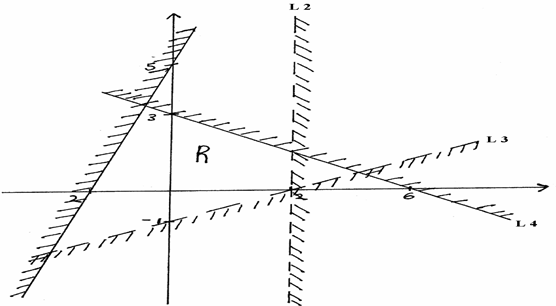
- Write down the inequalities that define the region IR.(Solved)
Write down the inequalities that define the region IR.
Date posted: September 16, 2019. Answers (1)
- Given that 2log2t + logt2 = 3 Calculate the value of t.(Solved)
Given that 2log2t + logt2 = 3 Calculate the value of t.
Date posted: September 16, 2019. Answers (1)
- A triangle ABC is transformed by the matrix
to give a straight line. Find the acute angle x in the matrix.
(Solved)
A triangle ABC is transformed by the matrix
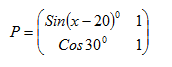
to give a straight line. Find the acute angle x in the matrix.
Date posted: September 16, 2019. Answers (1)
- Use completing squares method to solve for X
3x2 +18x + 15 = 0(Solved)
Use completing squares method to solve for X
3x2 +18x + 15 = 0
Date posted: September 16, 2019. Answers (1)
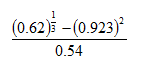
- Use logarithm tables to evaluate.(Solved)
Use logarithm tables to evaluate.
Date posted: September 16, 2019. Answers (1)
- Mr.Mutuku earns sh.15,500 p.m .He is housed by his employer and pay a rent of sh.1200 per month for taxation purposes his taxable income is...(Solved)
Mr.Mutuku earns sh.15,500 p.m .He is housed by his employer and pay a rent of sh.1200 per month for taxation purposes his taxable income is raised by 155.If he gets tax relief of sh.720 per month calculate his P.A.Y.E
Date posted: September 16, 2019. Answers (1)
- Claire earns sh.15,900 p.m and gets a tax relief of sh.7,200 p.a.How much should she pay as income tax p.m if taxation rates are as...(Solved)
Claire earns sh.15,900 p.m and gets a tax relief of sh.7,200 p.a.How much should she pay as income tax p.m if taxation rates are as shown below.
Date posted: September 16, 2019. Answers (1)