- The table below shows the rate of taxation in certain year.
A teacher in a technical institute paid a tax of Ksh. 10,855 after getting...(Solved)
The table below shows the rate of taxation in certain year.
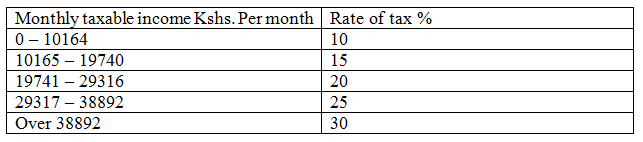
A teacher in a technical institute paid a tax of Ksh. 10,855 after getting a monthly tax relief of
Ksh. 1162. Calculate;
a)His monthly taxable income.
b)His other deductions per month.
Cooperative society’s contributions Kshs. 3,000
Loan repayment Kshs. 19,000
Union dues Kshs 400
Calculate his net salary per month.
Date posted: September 17, 2019. Answers (1)
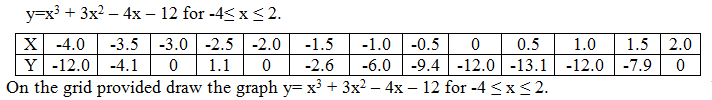
- The table below shows the values of x and y for the curve represented by;(Solved)
The table below shows the values of x and y for the curve represented by;
Date posted: September 17, 2019. Answers (1)
- A mixed school can accommodate a maximum of 440 students. The number of girls must be at least 120 while the number of boys must...(Solved)
A mixed school can accommodate a maximum of 440 students. The number of girls must be at least 120 while the number of boys must exceed 150.
Taking x to represent the number of boys and y the number of girls, write down all the inequalities representing the information above.
Date posted: September 16, 2019. Answers (1)
- The points with coordinates (5,5) and (-3, -1) are the ends of a diameter of a circle centre A. Determine;
a)The coordinates of A.
b)The equation of...(Solved)
The points with coordinates (5,5) and (-3, -1) are the ends of a diameter of a circle centre A. Determine;
a)The coordinates of A.
b)The equation of a circle, expressing it inform of x2 + y2 + ax + by + c = 0 where a, b and c are constants
Date posted: September 16, 2019. Answers (1)
- Using trapezoidal rule of 5 strips determine the area under the curve y=3x2 – 20 between the line x=1 and x=6. (Solved)
Using trapezoidal rule of 5 strips determine the area under the curve y=3x2 – 20 between the line x=1 and x=6.
Date posted: September 16, 2019. Answers (1)
- A farmer bought a tractor at Kshs.210,000 and sold at Kshs.52,500, after using it for five years. Calculate the annual rate of depreciation of the...(Solved)
A farmer bought a tractor at Kshs.210,000 and sold at Kshs.52,500, after using it for five years. Calculate the annual rate of depreciation of the tractor.
Date posted: September 16, 2019. Answers (1)
- Two chords PQ and RS of a circle meet a point X outside the circle. If PX = 6cm, QX = 3.5 cm and
XS...(Solved)
Two chords PQ and RS of a circle meet a point X outside the circle. If PX = 6cm, QX = 3.5 cm and
XS = 3 cm, find the length of the chord RS.
Date posted: September 16, 2019. Answers (1)
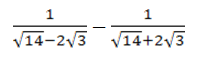
- Without using a calculator or mathematical tables simplify; (Solved)
Without using a calculator or mathematical tables simplify;
Date posted: September 16, 2019. Answers (1)
- Triangle ABC is the image of triangle XYZ when transformed under the matrix . If the area of triangle ABC is 770cm2, find the...(Solved)
Triangle ABC is the image of triangle XYZ when transformed under the matrix  . If the area of triangle ABC is 770cm2, find the area of triangle XYZ.
Date posted: September 16, 2019. Answers (1)
- The probability that Christine qualifies for a job as a marketing manager depends on whether she passes or fails in mathematics. The probability that she...(Solved)
The probability that Christine qualifies for a job as a marketing manager depends on whether she passes or fails in mathematics. The probability that she fails in mathematics is ⅓. If she passes the probability that she qualifies for the job is ¾. If she fail there is a probability of 1/6 that she qualifies for the job. What is the probability that she qualifies for the job.
Date posted: September 16, 2019. Answers (1)
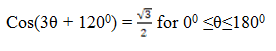
- Solve the equation(Solved)
Solve the equation
Date posted: September 16, 2019. Answers (1)
- The length and the breadth of a rectangular floor were measured and found to be 4.1m and 2.2m respectively. If a possible error of 0.01m...(Solved)
The length and the breadth of a rectangular floor were measured and found to be 4.1m and 2.2m respectively. If a possible error of 0.01m was made in each measurement. Calculate the percentage error in the area of the floor.
Date posted: September 16, 2019. Answers (1)
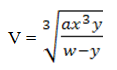
- Make y the subject of the formula.(Solved)
Make y the subject of the formula.
Date posted: September 16, 2019. Answers (1)
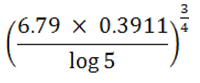
- Use logarithms, correct to 4 decimal places to evaluate(Solved)
Use logarithms, correct to 4 decimal places to evaluate
Date posted: September 16, 2019. Answers (1)
- The figure below shows cuboids ABCDEFGH. Given that AB=12 cm, BC= 8 cm and BF=4 cm.
(a)State the projection of AG on the plane EFGH.
(b)Determine the...(Solved)
The figure below shows cuboids ABCDEFGH. Given that AB=12 cm, BC= 8 cm and BF=4 cm.
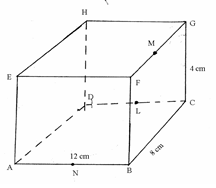
(a)State the projection of AG on the plane EFGH.
(b)Determine the angle between the line AG and the Plane EFGH.
(c)Given that L! M and N are the mid points DC, FG and AB respectively, determine the angle between the planes ADM and NLM.
(d)Find the angle between the skew lines AG and BC.
Date posted: September 16, 2019. Answers (1)
- Two variables A and B are believed to be related by a law of the form A=mnB + 1.1 where m andn are constants. The...(Solved)
Two variables A and B are believed to be related by a law of the form A=mnB + 1.1 where m and n are constants. The table below shows corresponding values of A and B as obtained from an experiment.
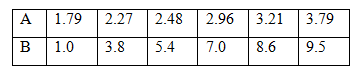
By drawing a suitable straight line graph estimate the values of m and n.
Date posted: September 16, 2019. Answers (1)
- (a)Bag A contains 4 red balls and 5 white balls while bag B contains 6 red balls and 4 white ones.
(i)A bag is picked at...(Solved)
(a)Bag A contains 4 red balls and 5 white balls while bag B contains 6 red balls and 4 white ones.
(i)A bag is picked at random and a ball is picked, find the probability that the ball is
white.
(ii)A ball is removed from A and placed in bag B. Two balls are then picked from B at random one at a time without replacement; find the probability that the two balls are of the same colour.
(b)Three boys and three girls sit in a row of six seats. Find the probability that:-
(i)Three girls sit together.
(ii)The girls and boys sit in alternative seats.
Date posted: September 16, 2019. Answers (1)
- A1B1C1D1 is the image of ABCD under a shear parallel to x – axis D(2,4) is mapped onto D1(1,4) while A(-1,1) is mapped onto A1(1,1)....(Solved)
A1B1C1D1 is the image of ABCD under a shear parallel to x – axis D(2,4) is mapped onto D1(1,4) while A(-1,1) is mapped onto A1(1,1). If the co – ordinates of A,B,C and D are (-1,1), (0,1), (3,4) and (2,4) respectively:-
(a)Draw ABCD and A1 B1C1 and D1 under the shear on the grid provided and state
Co-ordinates of B1 and C1.
(b)State the invariant line.
(c)A1 B1C1 and D1 undergoes a stretch parallel to y – axis with scale factor -2 and invariant line y =3. On the same grid, draw A//B//C//D// the image of A1 B1C1 D1 under the stretch
(d)Describe completely the transformation that maps A//B//C//D// onto ABCD.
Date posted: September 16, 2019. Answers (1)
- The table below shows marks obtained by 80 form four pupils in an examination.
(a)draw an Ogive curve.
(b)Use your graph to determine:-
(i)The median mark.
(ii)The quartile deviation.
(iii)The...(Solved)
The table below shows marks obtained by 80 form four pupils in an examination.
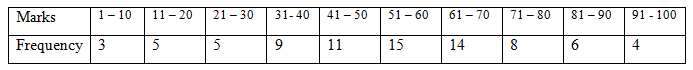
(a)draw an Ogive curve.
(b)Use your graph to determine:-
(i)The median mark.
(ii)The quartile deviation.
(iii)The range of marks obtained by the middle 60%.
Date posted: September 16, 2019. Answers (1)
- Use a ruler and compass ONLY for all constructions in this question.
(a)Construct a triangle ABC in which AB=6 cm, BC= 7 cm and angle ABC...(Solved)
Use a ruler and compass ONLY for all constructions in this question.
(a)Construct a triangle ABC in which AB=6 cm, BC= 7 cm and angle ABC = 750.
(b)Measure
(i)the length of AC
(ii)the angle ACB
(c)(i)Construct the locus of p such that BP = PC
(ii)Construct the locus of Q such that Q is on the opposite side of BC as A and angle
BCQ = 300.
(d)(i)the locus of P and Q meet at X, mark X .
(ii)Construct the locus of R in which angle BRC = 1200.
Date posted: September 16, 2019. Answers (1)