- The diagram below represents a neurone.(Solved)
The diagram below represents a neurone.
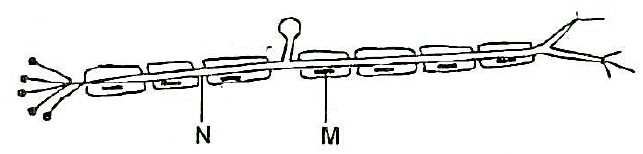
a) Name the neurone shown in the above diagram.
b) State the functions of parts labeled N and M.
c) Using an arrow indicate the direction of impulse transmission on the diagram.
Date posted: September 17, 2019. Answers (1)
- Give two reasons why the evolution of human enabled him to survive better than his hominid ancestors.(Solved)
Give two reasons why the evolution of human enabled him to survive better than his hominid ancestors.
Date posted: September 17, 2019. Answers (1)
- The diagram below shows a section through the mammalian skin.(Solved)
The diagram below shows a section through the mammalian skin.

a. Name the parts labeled Y and X
b. State the function of the parts labeled W and Z
c. Explain the changes that occur on the skin when it is cold
Date posted: September 17, 2019. Answers (1)
- A certain type of gene mutation changed the word „skip? to sip. Identify the type of gene mutation that occurred.(Solved)
A certain type of gene mutation changed the word „skip‟ to sip. Identify the type of gene mutation that occurred.
Date posted: September 17, 2019. Answers (1)
- The diagram below shows a flow chart of blood clotting mechanism in a human.(Solved)
The diagram below shows a flow chart of blood clotting mechanism in a human.

a) Name the enzymes represented by the letters T and S.
b) Name the final products of the mechanism represented by letter R.
Date posted: September 17, 2019. Answers (1)
- The diagram below represents the vertical section of a fruit.(Solved)
The diagram below represents the vertical section of a fruit.

a) Suggest the possible agent of dispersal of this fruit.
b) Explain two observable features that adapt the fruit to its mode of dispersal.
Date posted: September 17, 2019. Answers (1)
- Using the table below, answer the questions that follow.(Solved)
a)Using the table below, answer the questions that follow.

Suggest the possible habitat of the plants from the leaves were obtained
A
B
C
B) State the modifications in the stomata of leaf C
Date posted: September 17, 2019. Answers (1)
- i) Name the blood vessels that supplies the cardiac muscles with its requirements.
ii) State the congenital defect of the blood vessels resulting from prolonged...(Solved)
i) Name the blood vessels that supplies the cardiac muscles with its requirements.
ii) State the congenital defect of the blood vessels resulting from prolonged large intake of cholesterol in the blood.
Date posted: September 17, 2019. Answers (1)
- A cross between a red flowered plants and white flowered plants produced plants with pink flowers. Using letter R to represent the gene for red...(Solved)
A cross between a red flowered plants and white flowered plants produced plants with pink flowers. Using letter R to represent the gene for red color and W for white.
a) What were the parental genotypes?
b) Work out the cross between f1 generations.
c) State the phenotypic and genotypic ratios of the f2 generations.
Date posted: September 17, 2019. Answers (1)
- The figures below illustrate specialized cells in an animal body.(Solved)
The figures below illustrate specialized cells in an animal body.

a) Identify the cell M and N.
b) State the structural differences between M and N
c) Which of the above specialized cells is found in the gut.
Date posted: September 17, 2019. Answers (1)
- Examine the diagram below and answer the questions that follows.(Solved)
Examine the diagram below and answer the questions that follows.

A...............................
B................................
C.....................................
D....................................
b) State the type of germination exhibited by the seedling above
c) State and explain three environmental conditions necessary for germination.
Date posted: September 17, 2019. Answers (1)
- The diagram below represents a pyramid of biomass derived from certain Ecosystem.(Solved)
The diagram below represents a pyramid of biomass derived from certain Ecosystem.

a) Suggest the type of ecosystem from which the pyramid was derived.
b) State the significance of short food chains is an ecosystem.
Date posted: September 17, 2019. Answers (1)
- The flow diagram below represents passage of a meal through the human digestive system. Study the diagram and answer the questions that follow.(Solved)
The flow diagram below represents passage of a meal through the human digestive system. Study the diagram and answer the questions that follow.

(a) Name the physical process that will occur in mouth cavity
(b) Name the digestive juices B and C
B...........................
C...........................
(c) Explain two ways in which the digestive system is protected from corrosive effects of digestive juices.
(d) Name the hormone that stimulate secretion of juice B.
(e) Identify two contents of digestive juice A
Date posted: September 17, 2019. Answers (1)
- The table below shows the percentage composition of carbon (iv) oxide and oxygen in inhaled and exhaled air,(Solved)
The table below shows the percentage composition of carbon (iv) oxide and oxygen in inhaled and exhaled air,

Explain the differences in percentage of the two gases in inhaled and exhaled air.
a) Oxygen
b) Carbon (Iv) oxide
Date posted: September 17, 2019. Answers (1)
- Name the source of hydrochloric acid in the mammalian stomach.(Solved)
Name the source of hydrochloric acid in the mammalian stomach.
Date posted: September 17, 2019. Answers (1)
- The diagram below shows the structure of a human ear.(Solved)
The diagram below shows the structure of a human ear.

a. State functions of human ear
b. Give the name of structures labeled C, G. F
c. What is the function of the structure labeled H
Date posted: September 17, 2019. Answers (1)
- Study the diagram below and answer the question that follows.(Solved)
Study the diagram below and answer the question that follows.

i) Identify the muscle represented by X and Y.
ii) Describe how muscle X and Y cause straightening of joint Z.
c) Name joint Z.
Date posted: September 17, 2019. Answers (1)
- An experiment shown below was a set up to investigate a certain physiological process in plants.(Solved)
An experiment shown below was a set up to investigate a certain physiological process in plants.

a) What process was being investigated? (1 mark)
b) What effect will the following have on the observation made in (a) above?
i) Fanning the shoot
ii) Removing all the leaves from the shoot.
iii) Placing the set up in the dark.
Date posted: September 17, 2019. Answers (1)
- (a).Identify organs B and D in photograph T2 and state the class of organism from which they were obtained.(Solved)
(a).Identify organs B and D in photograph T2 and state the class of organism from which they were obtained.

(b) State the common function of the organs identified in (a) above.
(c) Name the parts of the body where B and D in photograph T2 are found
(d) List the adaptations of D to its functions
(e) Using observable features only, state how B is adapted to its function
Date posted: September 16, 2019. Answers (1)
- Photographs R1 and R2 show a certain response in plants.(Solved)
Photographs R1 and R2 show a certain response in plants.

a) Explain how the response shown above occurs.
b) What is the biological significance of the response shown by X?
Date posted: September 16, 2019. Answers (1)