- The table below shows corresponding values of X and Y which are believed to be connected by a relation of the form Y = abx...(Solved)
The table below shows corresponding values of X and Y which are believed to be connected by a relation of the form Y = abx – 10 where a and b are constants.

By drawing an appropriate straight line graph on the grid provided
(i) Find the approximate numerical values of a and b
(ii) Hence establish the particular mathematical equation connecting the variables X and Y
b)By using the equation find the value of Y when X = 4.5 to the nearest Unit
Date posted: September 17, 2019. Answers (1)
- A city x is at (70°S, 90°E) and another city Y is at (70°S, 90° W)
a)Find the distance in nm from city X to City...(Solved)
A city x is at (70°S, 90°E) and another city Y is at (70°S, 90° W)
a)Find the distance in nm from city X to City Y:
i)Along a greet circle
ii) Along a parallel of latitude answer t (4.s .f)
b)A plane left town X speeding west at speed of 400knots
i)How long did it take to reach town Y (Give answer in hours and nearest minutes
ii)If the plane left city X at 8.30 A.M Monday local time, at what time did it reach city Y?
Date posted: September 17, 2019. Answers (1)
- In a triangle below AOB, OA = a, OB = b, M is the midpoint of AB and N is a point on OB such...(Solved)
In a triangle below AOB, OA = a, OB = b, M is the midpoint of AB and N is a point on OB such that ON: NB = 1:2 AN and OM intersect at P

a) Express the following vectors in terms of a and b
AB
OM
AN
If OP = SOM express OP in terms of t, a and b
b) If AP = tAN express
AP in terms of t , a and b
c)Hence express OP in terms of t, a and b
d)Using the results above solve for s and t
Date posted: September 17, 2019. Answers (1)
- Convert the following recurring decimal to a fraction 5.3°17°(Solved)
Convert the following recurring decimal to a fraction 5.3°17°
Date posted: September 17, 2019. Answers (1)
- The figure below shows a solid with the base ABCD being a rectangle. AB = 16cm, BC = 12cm and CE = 20cm
Calculate the angle...(Solved)
The figure below shows a solid with the base ABCD being a rectangle. AB = 16cm, BC = 12cm and CE = 20cm

Calculate the angle between the planes EBD and ABCD.
Date posted: September 17, 2019. Answers (1)
- The Figure below shows a circle with centre o
Determine the co-ordinates of the centre radius of the circle and find the equation of the circle
(Solved)
The Figure below shows a circle with centre o

Determine the co-ordinates of the centre radius of the circle and find the equation of the circle
Date posted: September 17, 2019. Answers (1)
- Factorize a2 –b2 hence find the exact value of 48972 – 47972(Solved)
Factorize a2 –b2 hence find the exact value of 48972 – 47972
Date posted: September 17, 2019. Answers (1)
- a) Given that y = 2cos (2x – 30)o is the equation of a curve state the amplitude and period of the curve
b)Given that y...(Solved)
a) Given that y = 2cos (2x – 30)o is the equation of a curve state the amplitude and period of the curve
b)Given that y = -1 1/5 in the above function, find x where 
Date posted: September 17, 2019. Answers (1)
- Machine A can do a piece of work n 6 hours while machine B can do the same piece of work in 9 hours. Machine...(Solved)
Machine A can do a piece of work n 6 hours while machine B can do the same piece of work in 9 hours. Machine A was set to do the piece of work but after 3 hours it broke down and machine B did the rest of the work. Find how long would machine B take to do the rest of the work
Date posted: September 17, 2019. Answers (1)
- Make t the subject of the formular(Solved)
Make t the subject of the formular

Date posted: September 17, 2019. Answers (1)
- Given the equation of a curve
Y = (2x +2)(x2 + 3)
i)Find the function of the gradient of the curve and its value when...(Solved)
Given the equation of a curve
Y = (2x +2)(x2 + 3)
i)Find the function of the gradient of the curve and its value when x = 3/2
ii)Determine the equation of the normal to the curve at the point (-2, 3)
Date posted: September 17, 2019. Answers (1)
- Use matrix method to solve the following pair of simultaneous equation
3x + 2y = 12
-y + 4x = 5
(Solved)
Use matrix method to solve the following pair of simultaneous equation
3x + 2y = 12
-y + 4x = 5
Date posted: September 17, 2019. Answers (1)
- P varies directly as Q and inversely as the square of R. When Q=5 and R=3, P=20. Find R when P=21.6 and Q=15 (Solved)
P varies directly as Q and inversely as the square of R. When Q=5 and R=3, P=20. Find R when P=21.6 and Q=15
Date posted: September 17, 2019. Answers (1)
- A Kenyan bank buys and sells foreign currencies as shown in the table below:
A tourist arrived in Kenya with 105,900 sterling pounds changed the...(Solved)
A Kenyan bank buys and sells foreign currencies as shown in the table below:

A tourist arrived in Kenya with 105,900 sterling pounds changed the whole amount in Kenyan shillings. While in Kenya he spent Kshs 4,800,000 and then changed the balance to American dollars. Calculate to the nearest dollar how many dollars he then received
Date posted: September 17, 2019. Answers (1)
- Without using tables and calculators simplify by rationalizing the denominator
Leave your expression in surd form
(Solved)
Without using tables and calculators simplify  by rationalizing the denominator
Leave your expression in surd form
Date posted: September 17, 2019. Answers (1)
- The 1st 2nd and 5th terms of an arithmetic progression series are three consecutive terms of a G.P, find the ratio of the G.P(Solved)
The 1st 2nd and 5th terms of an arithmetic progression series are three consecutive terms of a G.P, find the ratio of the G.P
Date posted: September 17, 2019. Answers (1)
- Solve the compound inequalities and hence list down the integers which satisfy the inequalities (Solved)
Solve the compound inequalities 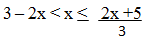 and hence list down the integers which satisfy the inequalities
Date posted: September 17, 2019. Answers (1)
- Expand (1 – 2x)5 hence use the expansion up to the forth term to estimate the value of (0.8)5 correct to 3 decimal...(Solved)
Expand (1 – 2x)5 hence use the expansion up to the forth term to estimate the value of (0.8)5 correct to 3 decimal places
Date posted: September 17, 2019. Answers (1)
- Use logarithms tables to evaluate(Solved)
Use logarithms tables to evaluate
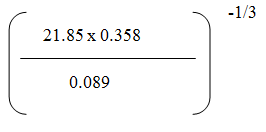
Date posted: September 17, 2019. Answers (1)
- A manufacturer discovers that a mixture of juice brand A which costs Kshs. 30 per litre and juice brand B which costs Kshs. 45 per...(Solved)
A manufacturer discovers that a mixture of juice brand A which costs Kshs. 30 per litre and juice brand B which costs Kshs. 45 per litre would cost Kshs. 40 per litre of the same mixture.
a)How much of each would be required to produce one litre of each mixture.
b)If the cost of production of juice brand A is shs. 27 per litre and juice brand B which costs shs. 42 per litre. What price must the manufacturer sell the mixture to make a profit of 20% per litre?
c)If the cost of production decreases by 10% for juice brand B, what price must the manufacturer sell to retain the same profit margin?
Date posted: September 17, 2019. Answers (1)