- The second, third and fourteenth terms of an Arithmetic progression are the three consecutive terms of a geometric progression. The 10th term of the arithmetic...(Solved)
The second, third and fourteenth terms of an Arithmetic progression are the three consecutive terms of a geometric progression. The 10th term of the arithmetic progression is 18. Find;
a) The first term and the common difference of the progression.
b) The sum of the first 10 terms of the progression.
c) The sixth term of the a.p
Date posted: September 18, 2019. Answers (1)
- A triangle with vertices A ( 1,3) B(2,1) and C (3,1) is mapped onto another triangle with vertices
A1(-3,1), B1 ( -1,2) and C1 (...(Solved)
A triangle with vertices A ( 1,3) B(2,1) and C (3,1) is mapped onto another triangle with vertices
A1(-3,1), B1 ( -1,2) and C1 ( -1,3).
Describe this transformation and find its matrix.
Date posted: September 18, 2019. Answers (1)
- Determine the possible value of x, for which the matrix below is singular. (Solved)
Determine the possible value of x, for which the matrix below is singular.

Date posted: September 18, 2019. Answers (1)
- Evaluate the area enclosed by the curve y=x3, the x –axis and the lines x=-2 and x =2. (Solved)
Evaluate the area enclosed by the curve y=x3, the x –axis and the lines x=-2 and x =2.
Date posted: September 18, 2019. Answers (1)
- A straight line through the points (4,6) and (2,4) meets the x-axis and y-axis and y –axis at points A and
B respectively. Determine the...(Solved)
A straight line through the points (4,6) and (2,4) meets the x-axis and y-axis and y –axis at points A and
B respectively. Determine the coordinates of points A and B
Date posted: September 18, 2019. Answers (1)
- Use binomial expansion to expand and simplify (1-3x)6 upto term in x3.
Hence approximate the value of (0.97)6 correct to 4 significant figures. (Solved)
Use binomial expansion to expand and simplify (1-3x)6 upto term in x3.
Hence approximate the value of (0.97)6 correct to 4 significant figures.
Date posted: September 18, 2019. Answers (1)
- Find the centre and radius of the circle of the equation x2 + y2 -6x -8y =0 (Solved)
Find the centre and radius of the circle of the equation x2 + y2 -6x -8y =0
Date posted: September 18, 2019. Answers (1)
- Solve the equation given below.
(Solved)
Solve the equation given below.

Date posted: September 18, 2019. Answers (1)
- The cross section of a house is in the shape of a pentagon, as shown in the figure below. Determine the
cross-sectional area of the house....(Solved)
The cross section of a house is in the shape of a pentagon, as shown in the figure below. Determine the
cross-sectional area of the house.

Date posted: September 18, 2019. Answers (1)
- Find the compound interest on sh. 21000 in 5years at 15% p.a (Solved)
Find the compound interest on sh. 21000 in 5years at 15% p.a
Date posted: September 18, 2019. Answers (1)
- Solve the equation(Solved)
Solve the equation 
Date posted: September 18, 2019. Answers (1)
- If p = , express q in terms of p (Solved)
If p =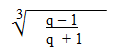 , express q in terms of p
Date posted: September 18, 2019. Answers (1)
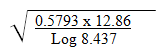
- Use logarithms to four decimal places to evaluate. (Solved)
Use logarithms to four decimal places to evaluate.
Date posted: September 18, 2019. Answers (1)
- A bag A has 5 green marbles, 9 red marbles and Y blue marbles, all identical except for colour. The total number of marbles in...(Solved)
A bag A has 5 green marbles, 9 red marbles and Y blue marbles, all identical except for colour. The total number of marbles in the bag is two more than double the number of blue marbles.
Three marbles are then randomly picked one at a time from bag A and placed in bag B.
(a) Find the value of Y.
(b) Find the probability that;
(i) The first two marbles picked are green
(ii) All the three marbles are of different colour
(iii) At least one of the three marbles placed in bag B are blue.
(iv) At most two marbles are red.
Date posted: September 18, 2019. Answers (1)
- Below is a sketch of the area bounded by the curve y=x2+3 and the line x=-2, x=4 and y=0.
(a) Estimate the area of the shaded...(Solved)
Below is a sketch of the area bounded by the curve y=x2+3 and the line x=-2, x=4 and y=0.
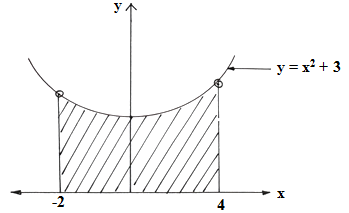
(a) Estimate the area of the shaded region using 6 strips by:
(i) The trapezoidal rule
(ii) Integration
(b) Find the percentage error in the area for the approximation in (a)(i) if the value in (a)(ii) is taken
as the exact area.
Date posted: September 18, 2019. Answers (1)
- A farmer has two tractors, A and B. The tractors working together can plough a farm in 2½ hours. One day the tractors started to...(Solved)
A farmer has two tractors, A and B. The tractors working together can plough a farm in 2½ hours. One day the tractors started to plough the farm together. After one hour ten minutes, tractor B broke down but A continued alone and completed the job after a further four hours.
(a) The fraction of the job done by tractor A after tractor B broke down.
(b) The time each tractor working alone would have taken to plough the farm.
Date posted: September 18, 2019. Answers (1)
- A point P divides line AB in the ratio 7:-5 where A and B are the points A(2,5,4) and B(-4,7,2). Find the co-ordinates of P....(Solved)
A point P divides line AB in the ratio 7:-5 where A and B are the points A(2,5,4) and B(-4,7,2). Find the co-ordinates of P.
Date posted: September 18, 2019. Answers (1)
- A two-digit positive number is such that the sum of its digits is nine. When the digits are reversed, the new number formed exceeds...(Solved)
A two-digit positive number is such that the sum of its digits is nine. When the digits are reversed,the new number formed exceeds the original number by 27. Find the original number.
Date posted: September 18, 2019. Answers (1)
- The equation of a circle, centre (-3,5) and radius 4 units is given as x2+y2+ax+by+c=0. Find the constants a, b and c.(Solved)
The equation of a circle, centre (-3,5) and radius 4 units is given as x2+y2+ax+by+c=0. Find the constants a, b and c.
Date posted: September 18, 2019. Answers (1)
- An approximation of fraction below is obtained by rounding off each value in the numerator to 4 significant figures and truncating each value in the...(Solved)
An approximation of fraction below is obtained by rounding off each value in the numerator to 4 significant figures and truncating each value in the denominator to 2 significant figures.
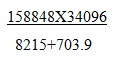
Find the approximate value of the resulting quotient, correct to 1 decimal place.
Date posted: September 18, 2019. Answers (1)