- Make x the subject of the formula:(Solved)
Make x the subject of the formula:

Date posted: September 18, 2019. Answers (1)
- Solve for ? in the equation(Solved)
Solve for θ in the equation
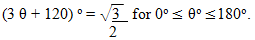
Date posted: September 18, 2019. Answers (1)
- The expression 1 + x/2 is taken as an approximation for v1 + x. Find the percentage error in doing so if x = 0.44.(Solved)
The expression 1 + x/2 is taken as an approximation for √1 + x. Find the percentage error in doing so if x = 0.44.
Date posted: September 18, 2019. Answers (1)
- Using logarithms, evaluate correct to 4d.p.(Solved)
Using logarithms, evaluate correct to 4d.p.
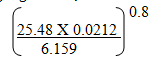
Date posted: September 18, 2019. Answers (1)
- Kisumu bus park allows 10m2 of parking space for each matatu and 30m2 for each bus. The total space
available is 3000m2. the maximum...(Solved)
Kisumu bus park allows 10m2 of parking space for each matatu and 30m2 for each bus. The total space
available is 3000m2. the maximum number of vehicles at any time must not exceed 20. There must be
at least as many matatus as buses. If the number of matatus is x and buses is y.
a) Write down three inequalities which must be satisfied.
b) On the grid provided, draw a graph to represent the in equalities in (a)
c)If the parking charge for a matatu is sh. 50 and for a bus is sh. 250, find how many vehicles of
each kind that should be admitted to maximize income.
d) Calculate the income in (c) above.
Date posted: September 18, 2019. Answers (1)
- The table below shows the corresponding values of x and y which are connected by a relation of the
form y = abx -10, where...(Solved)
The table below shows the corresponding values of x and y which are connected by a relation of the
form y = abx -10, where a and b are constant.
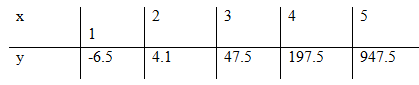
Draw a suitable linear graph and find the appropriate numerical values
of a and b
Date posted: September 18, 2019. Answers (1)
- The figure below is a tetrahedron. The base triangle ABC is right angled at B. AB = 16 cm and BC = 6cm....(Solved)
The figure below is a tetrahedron. The base triangle ABC is right angled at B. AB = 16cm and BC = 6cm. DA = DB = DC = 13cm. M is the mid point of line AB and DO is the height of the tetrahedron.
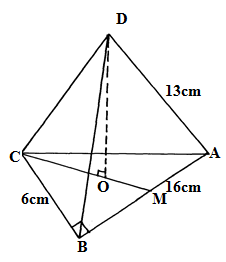
Calculate
(i) The height DO of the tetrahedron.
(ii) The height OM
(iii) The length DM.
Date posted: September 18, 2019. Answers (1)
- The heights of a tree seedling in a nursery were measured and recorded as in the table below.
a)Estimate the mean height of the tree seedlings...(Solved)
The heights of a tree seedling in a nursery were measured and recorded as in the table below.
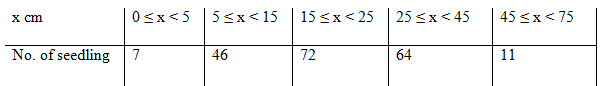
a)Estimate the mean height of the tree seedlings in the nursery.
b)Using a scale of 1cm to represent 10units a long the horizontal axis, and a scale of 1cm to represent 1
unit along the vertical axis, draw a histogram to represent the distribution.
Date posted: September 18, 2019. Answers (1)
- The second, third and fourteenth terms of an Arithmetic progression are the three consecutive terms of a geometric progression. The 10th term of the arithmetic...(Solved)
The second, third and fourteenth terms of an Arithmetic progression are the three consecutive terms of a geometric progression. The 10th term of the arithmetic progression is 18. Find;
a) The first term and the common difference of the progression.
b) The sum of the first 10 terms of the progression.
c) The sixth term of the a.p
Date posted: September 18, 2019. Answers (1)
- A triangle with vertices A ( 1,3) B(2,1) and C (3,1) is mapped onto another triangle with vertices
A1(-3,1), B1 ( -1,2) and C1 (...(Solved)
A triangle with vertices A ( 1,3) B(2,1) and C (3,1) is mapped onto another triangle with vertices
A1(-3,1), B1 ( -1,2) and C1 ( -1,3).
Describe this transformation and find its matrix.
Date posted: September 18, 2019. Answers (1)
- Determine the possible value of x, for which the matrix below is singular. (Solved)
Determine the possible value of x, for which the matrix below is singular.

Date posted: September 18, 2019. Answers (1)
- Evaluate the area enclosed by the curve y=x3, the x –axis and the lines x=-2 and x =2. (Solved)
Evaluate the area enclosed by the curve y=x3, the x –axis and the lines x=-2 and x =2.
Date posted: September 18, 2019. Answers (1)
- A straight line through the points (4,6) and (2,4) meets the x-axis and y-axis and y –axis at points A and
B respectively. Determine the...(Solved)
A straight line through the points (4,6) and (2,4) meets the x-axis and y-axis and y –axis at points A and
B respectively. Determine the coordinates of points A and B
Date posted: September 18, 2019. Answers (1)
- Use binomial expansion to expand and simplify (1-3x)6 upto term in x3.
Hence approximate the value of (0.97)6 correct to 4 significant figures. (Solved)
Use binomial expansion to expand and simplify (1-3x)6 upto term in x3.
Hence approximate the value of (0.97)6 correct to 4 significant figures.
Date posted: September 18, 2019. Answers (1)
- Find the centre and radius of the circle of the equation x2 + y2 -6x -8y =0 (Solved)
Find the centre and radius of the circle of the equation x2 + y2 -6x -8y =0
Date posted: September 18, 2019. Answers (1)
- Solve the equation given below.
(Solved)
Solve the equation given below.

Date posted: September 18, 2019. Answers (1)
- The cross section of a house is in the shape of a pentagon, as shown in the figure below. Determine the
cross-sectional area of the house....(Solved)
The cross section of a house is in the shape of a pentagon, as shown in the figure below. Determine the
cross-sectional area of the house.

Date posted: September 18, 2019. Answers (1)
- Find the compound interest on sh. 21000 in 5years at 15% p.a (Solved)
Find the compound interest on sh. 21000 in 5years at 15% p.a
Date posted: September 18, 2019. Answers (1)
- Solve the equation(Solved)
Solve the equation 
Date posted: September 18, 2019. Answers (1)
- If p = , express q in terms of p (Solved)
If p =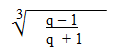 , express q in terms of p
Date posted: September 18, 2019. Answers (1)